This series was my way of documenting personal experiences and weather events during the Covid-19 pandemic. 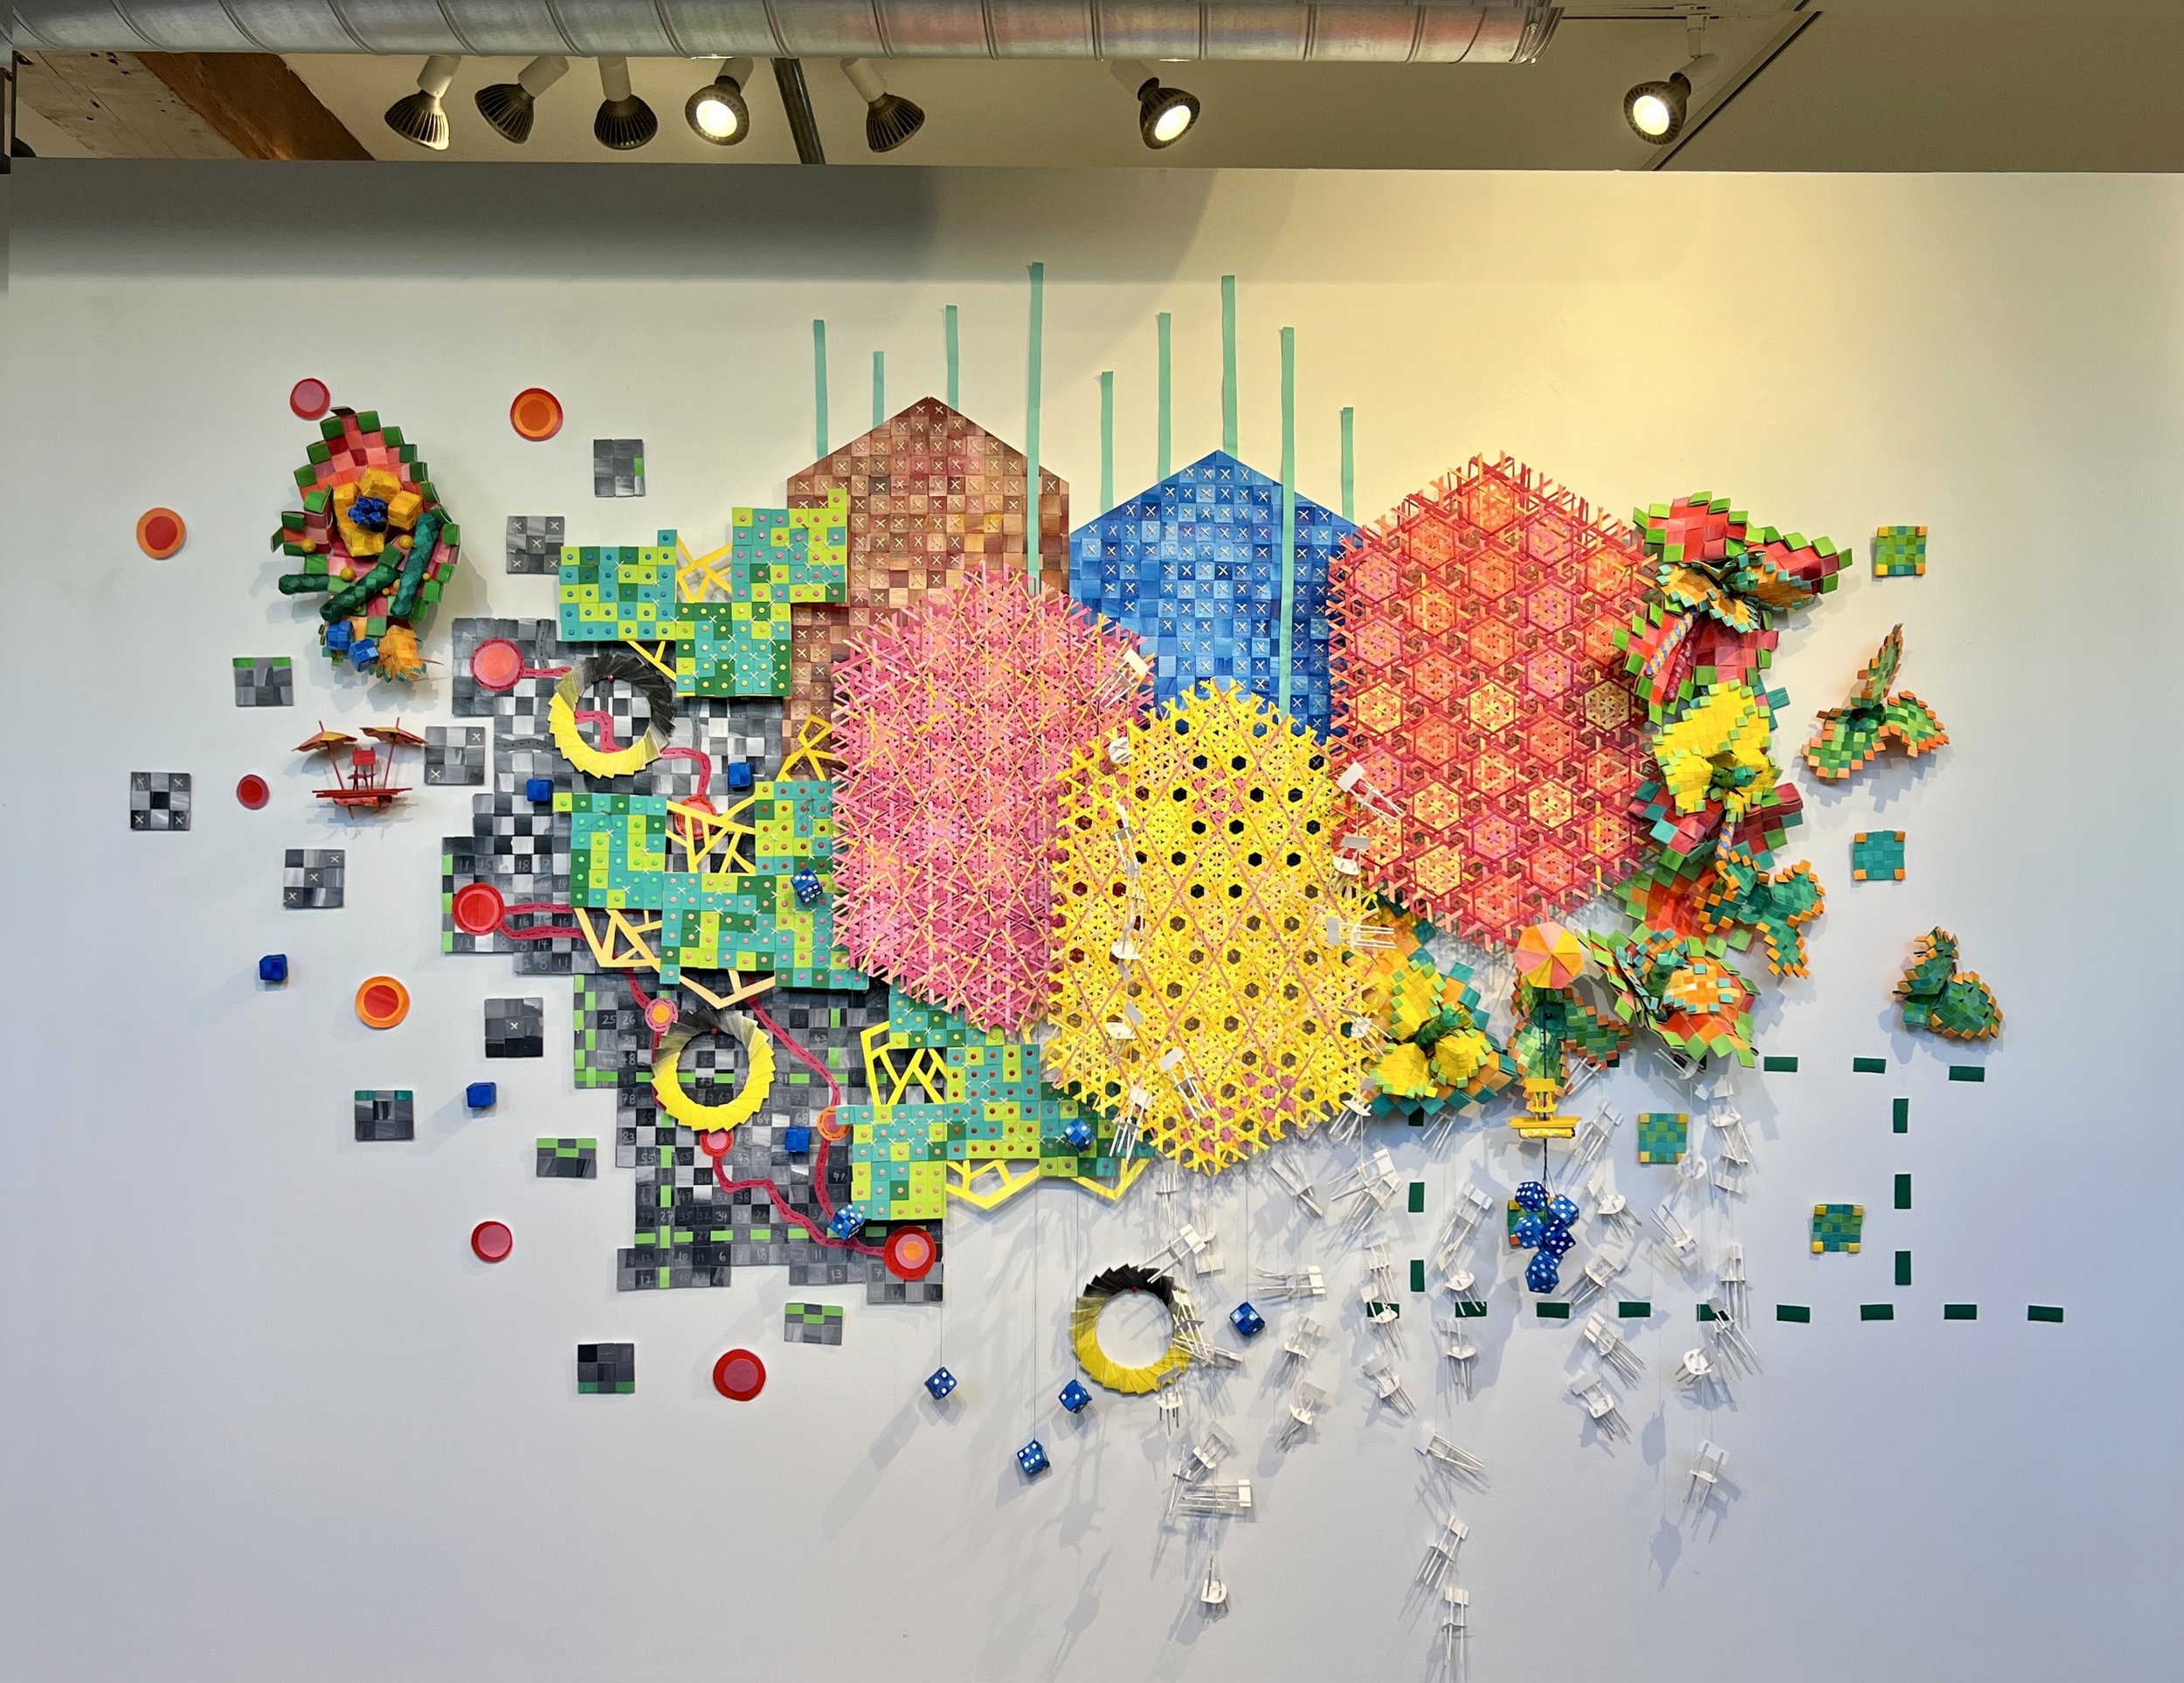
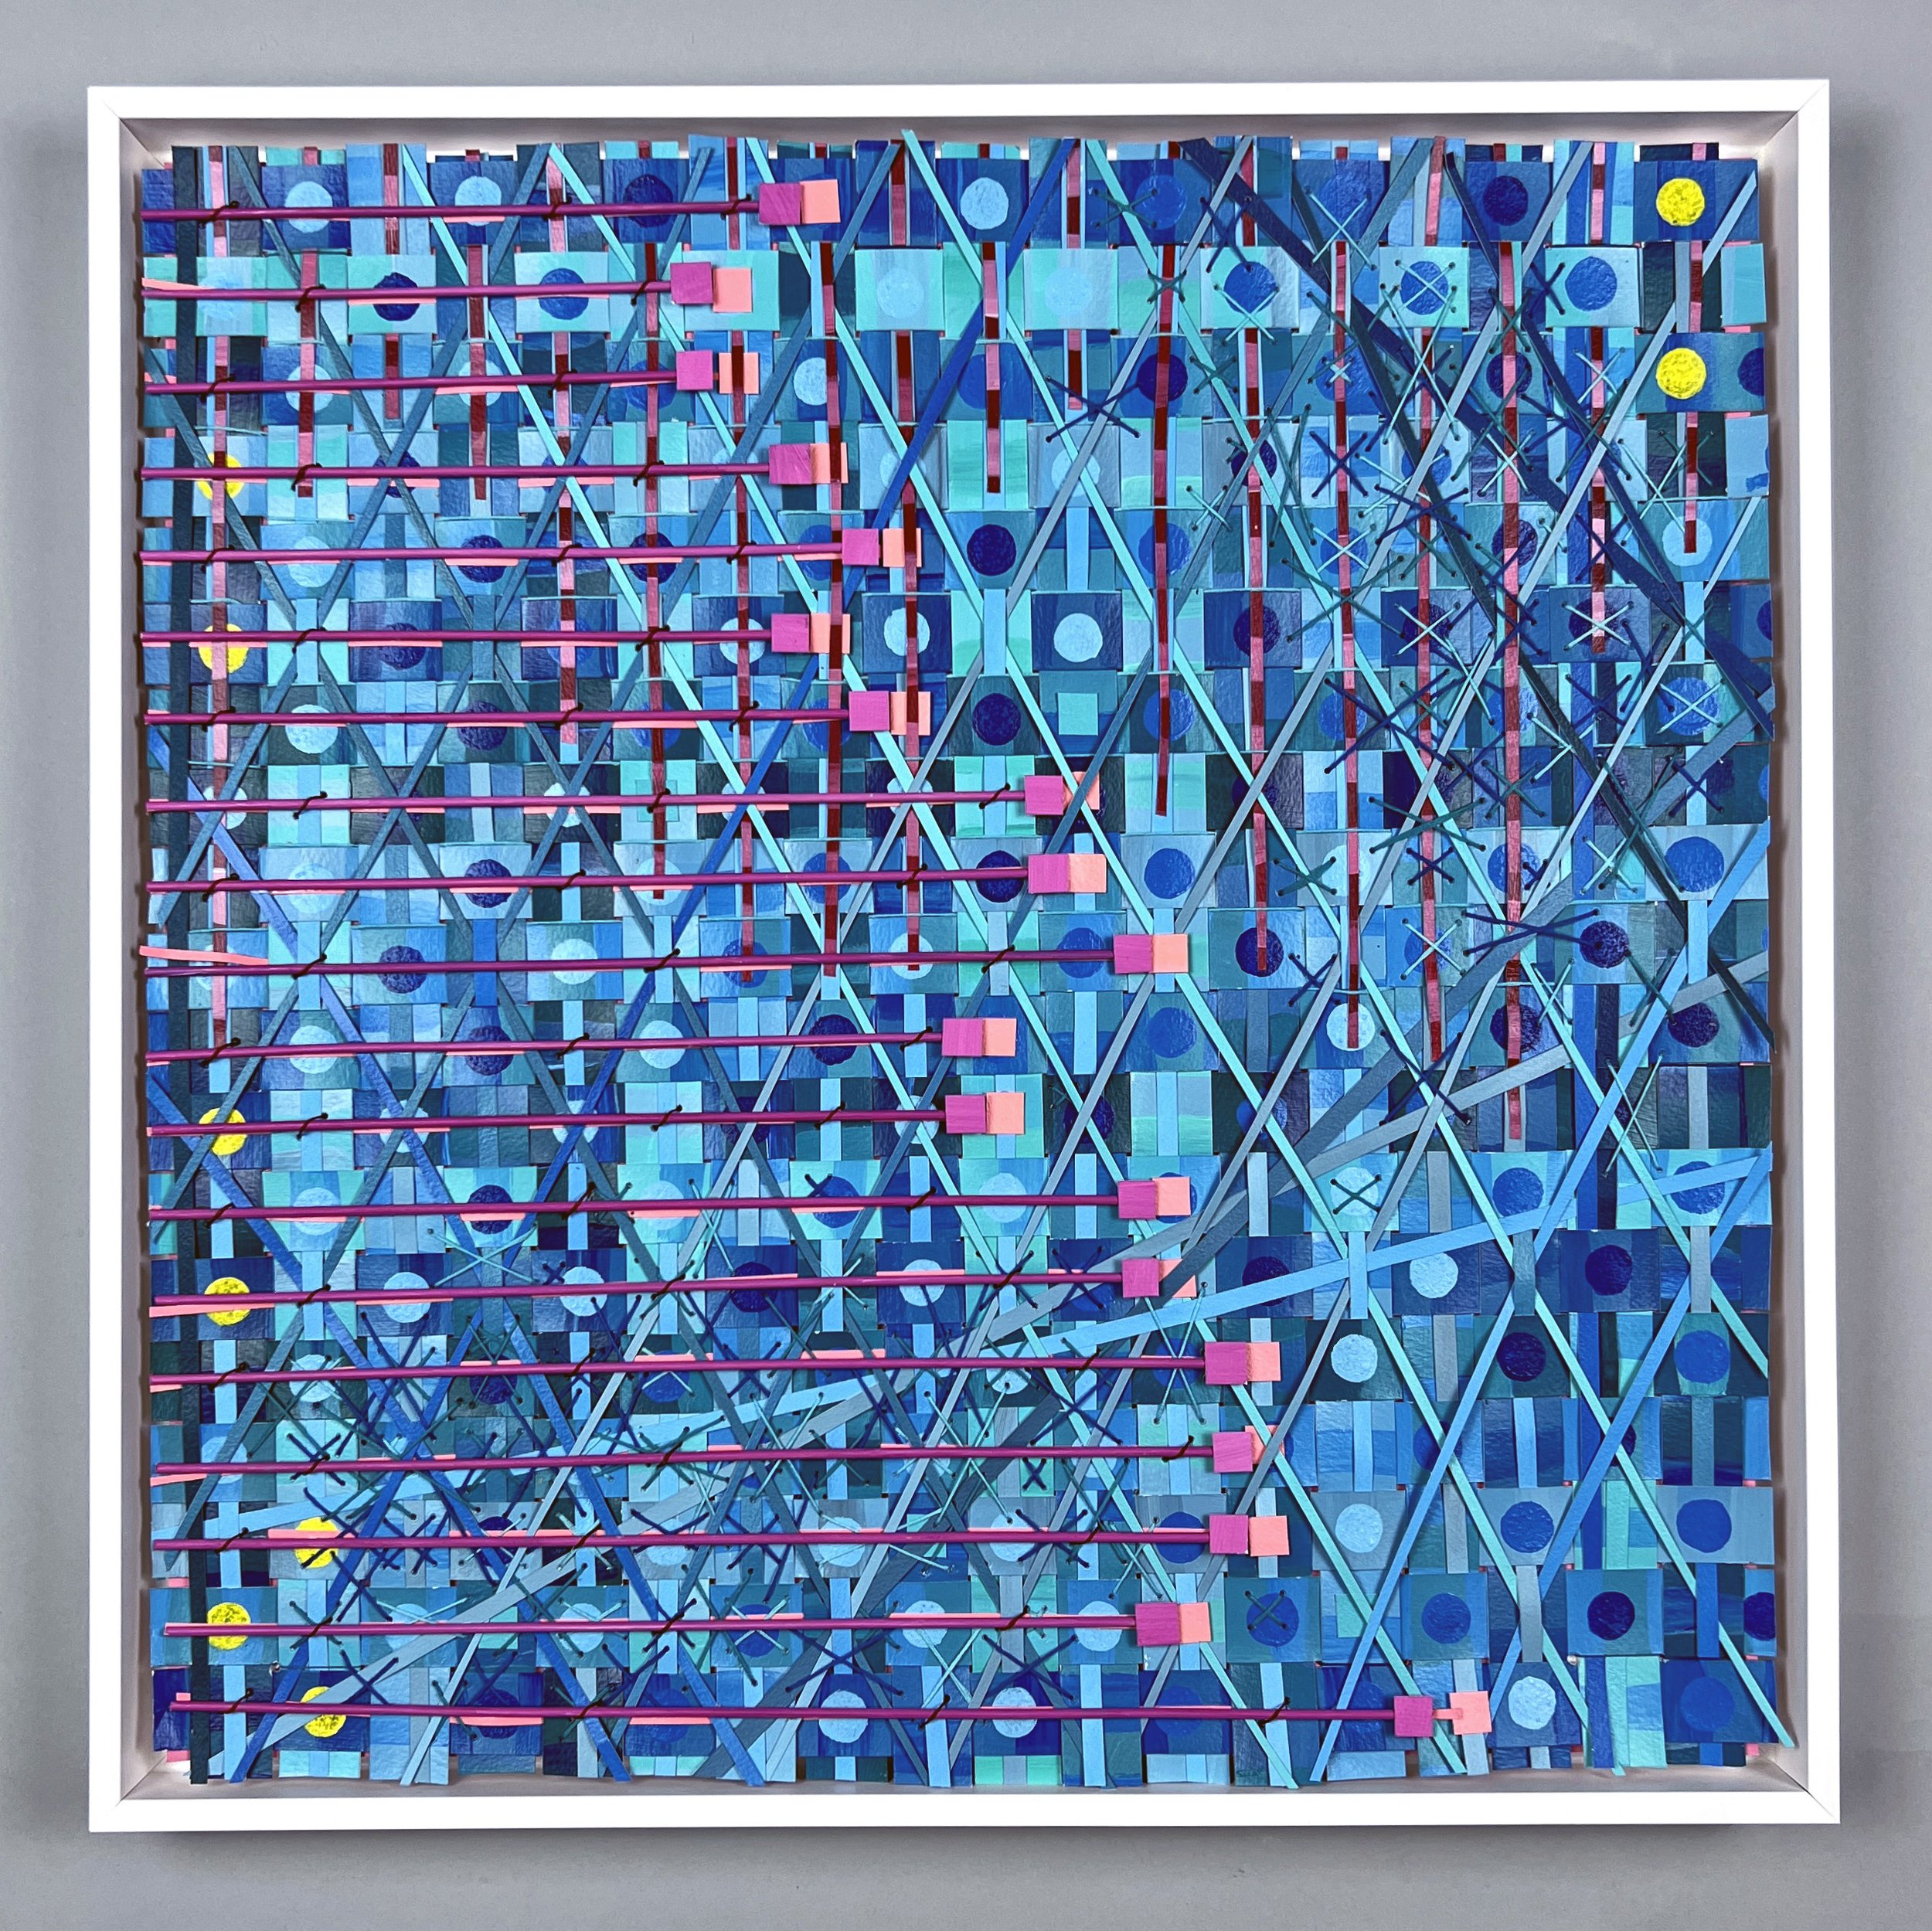
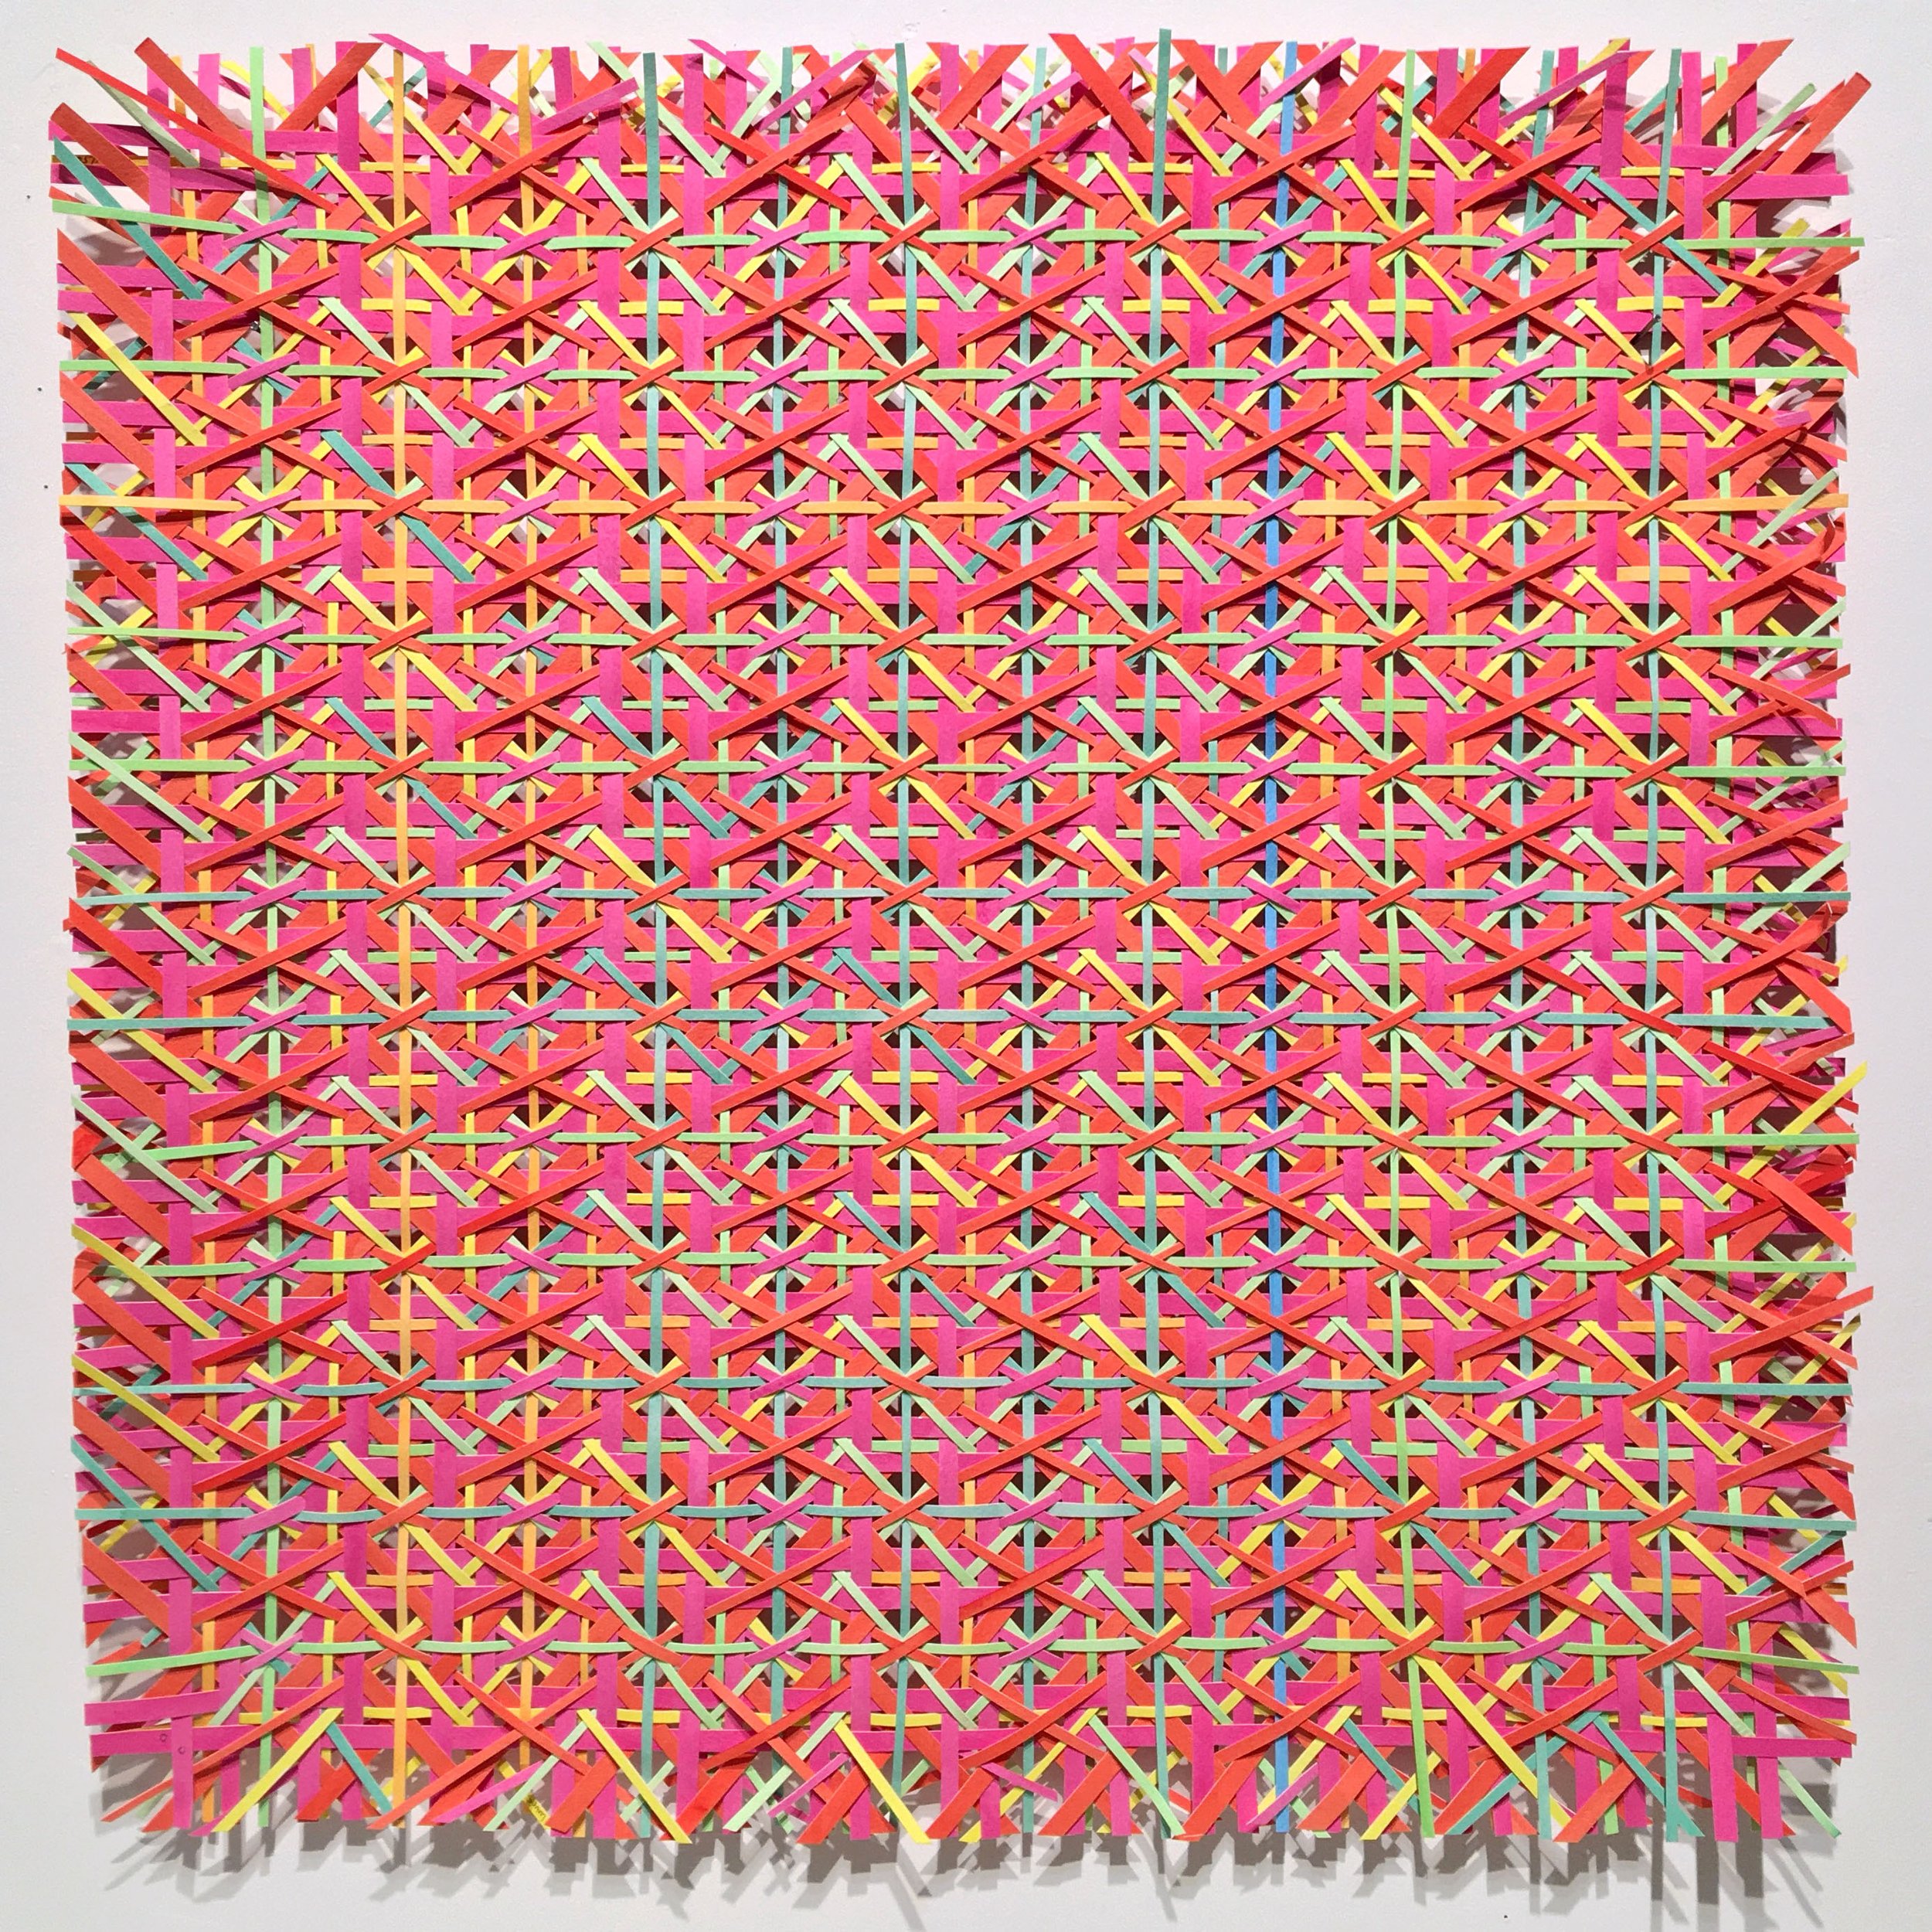
The Blindness of Seeing Patterns / 2021 / Paper, wood, data / 7'x5'x0.5'/ This piece translates Covid-19 and weather data related to the Summer of 2021.
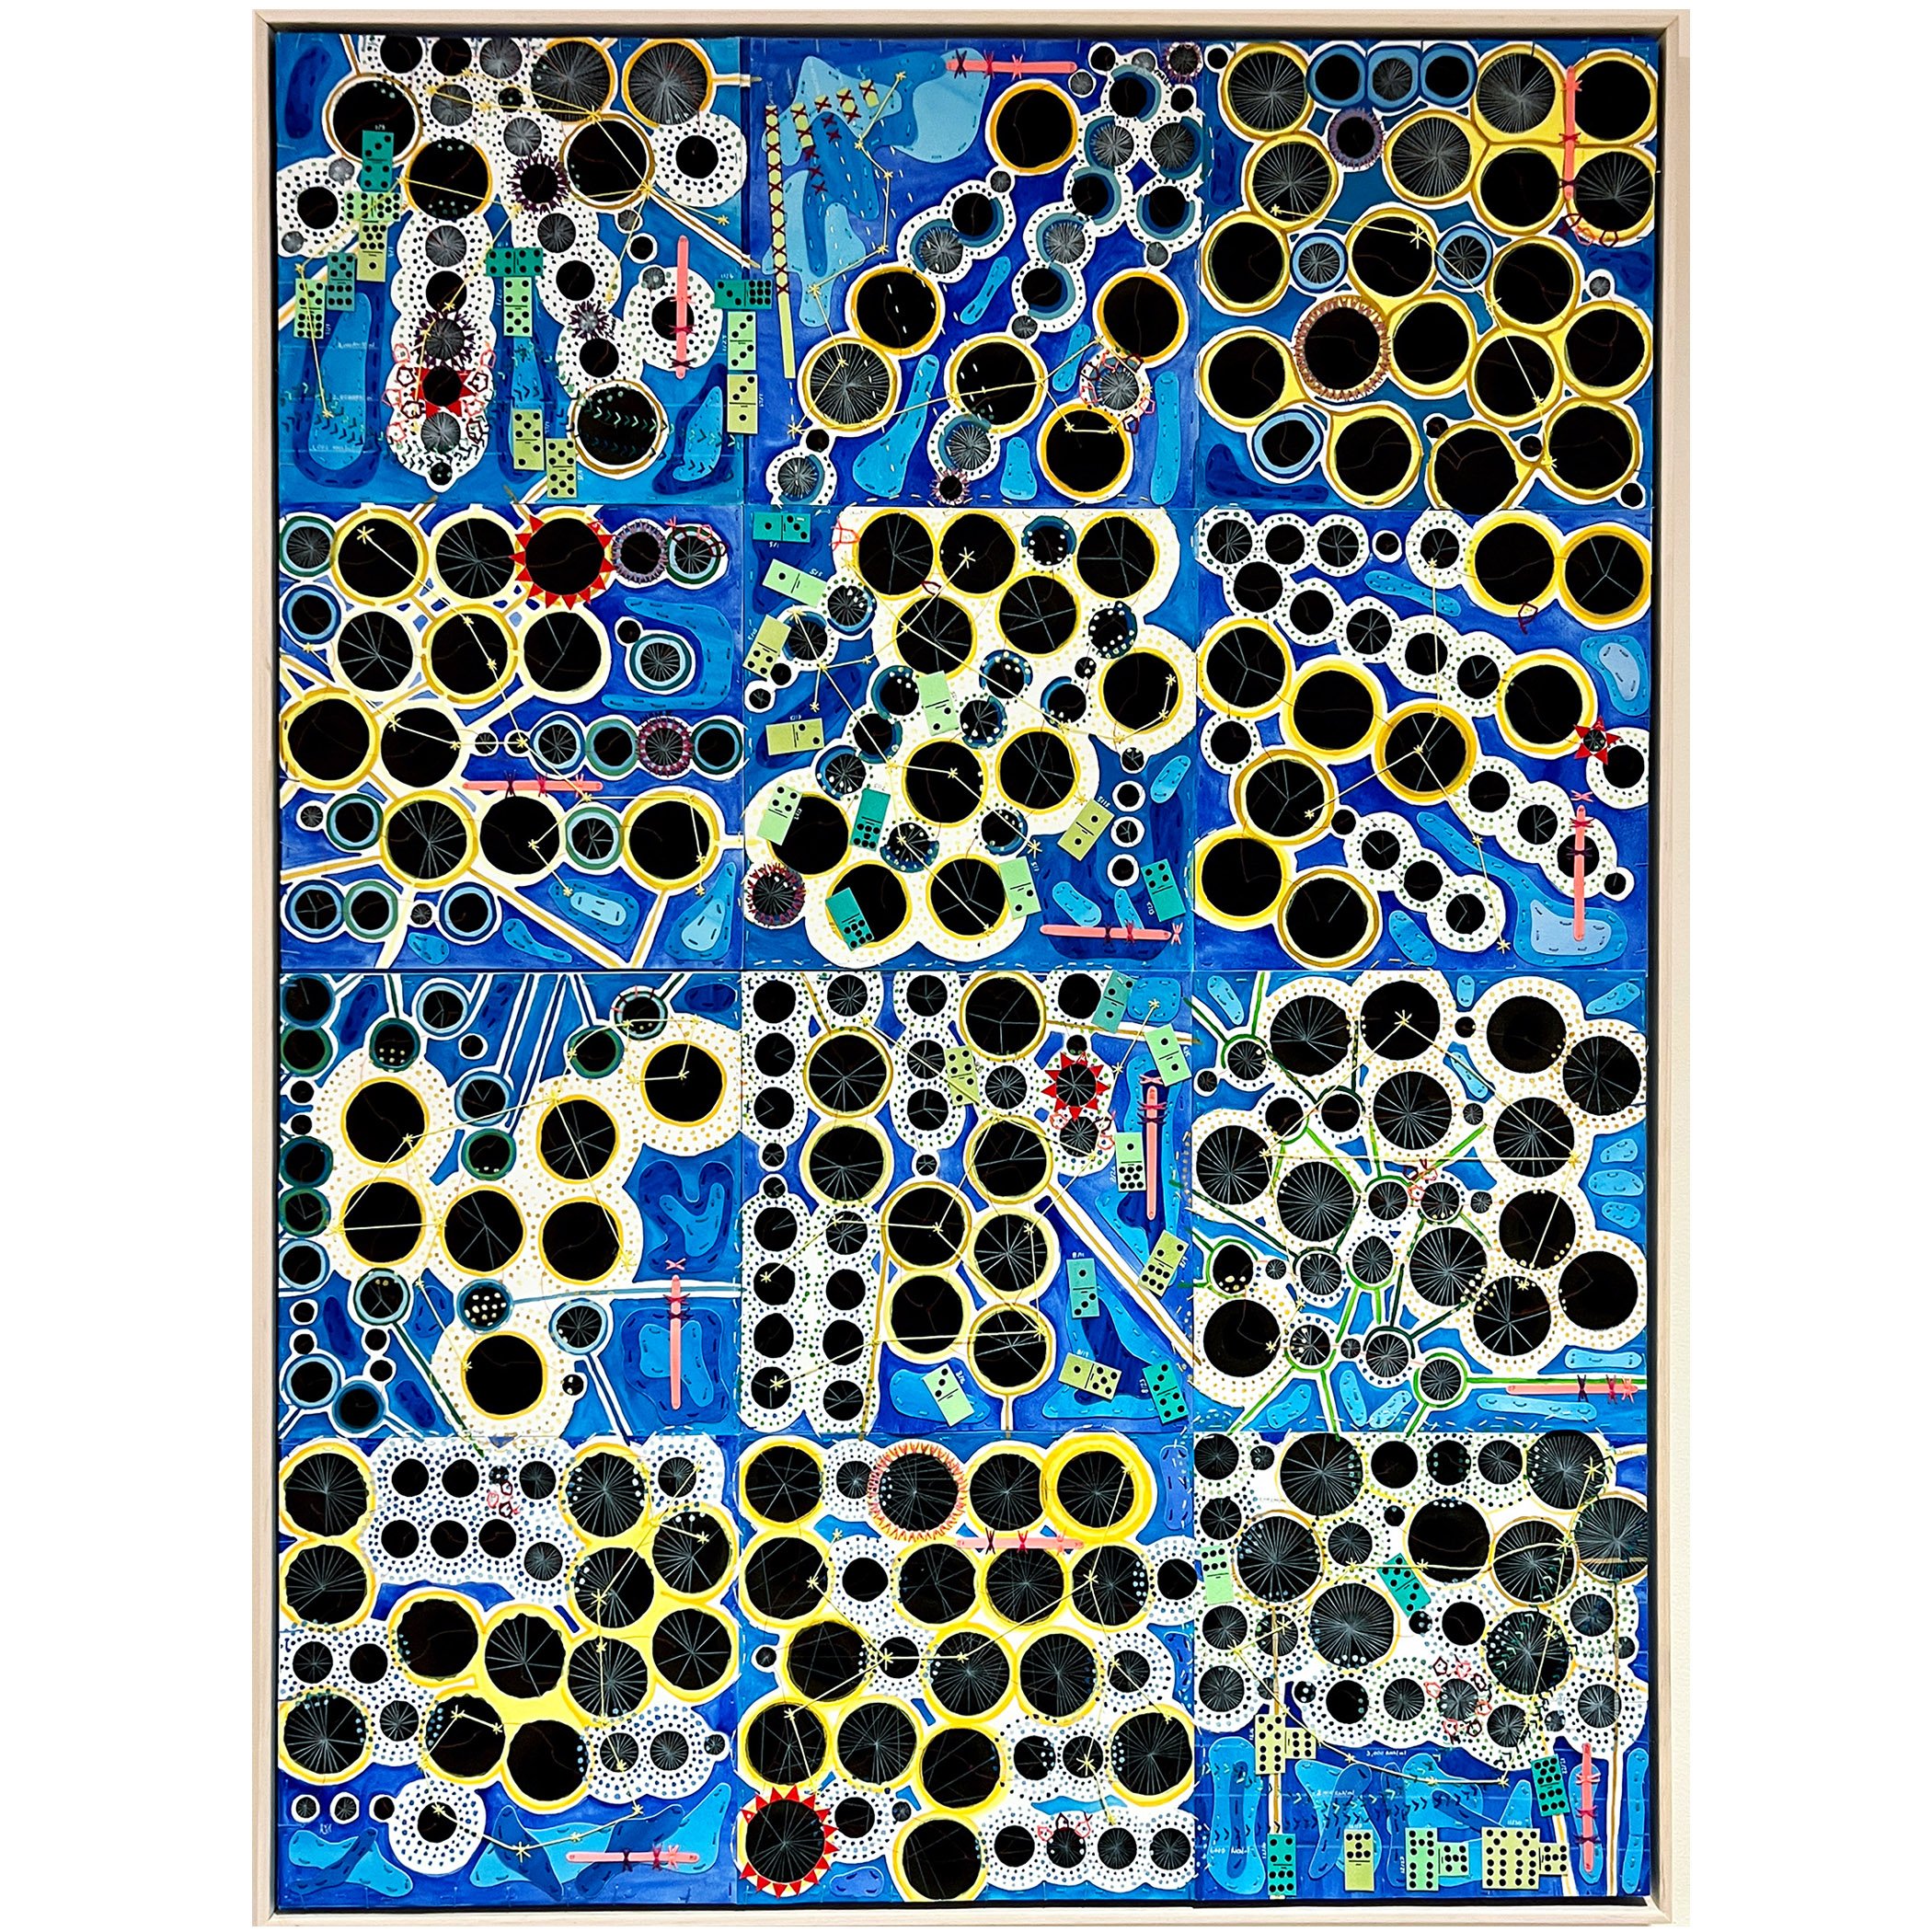
Life Lines / 2022 / Paper on canvas / 36” x 48” / Divided into 12 panels, each square translates weather data, COVID-19 deaths, hospitalization, sewage data, vaccination phases, and variants from January to December, 2021. Each white line is a human life lost to Covid-19.

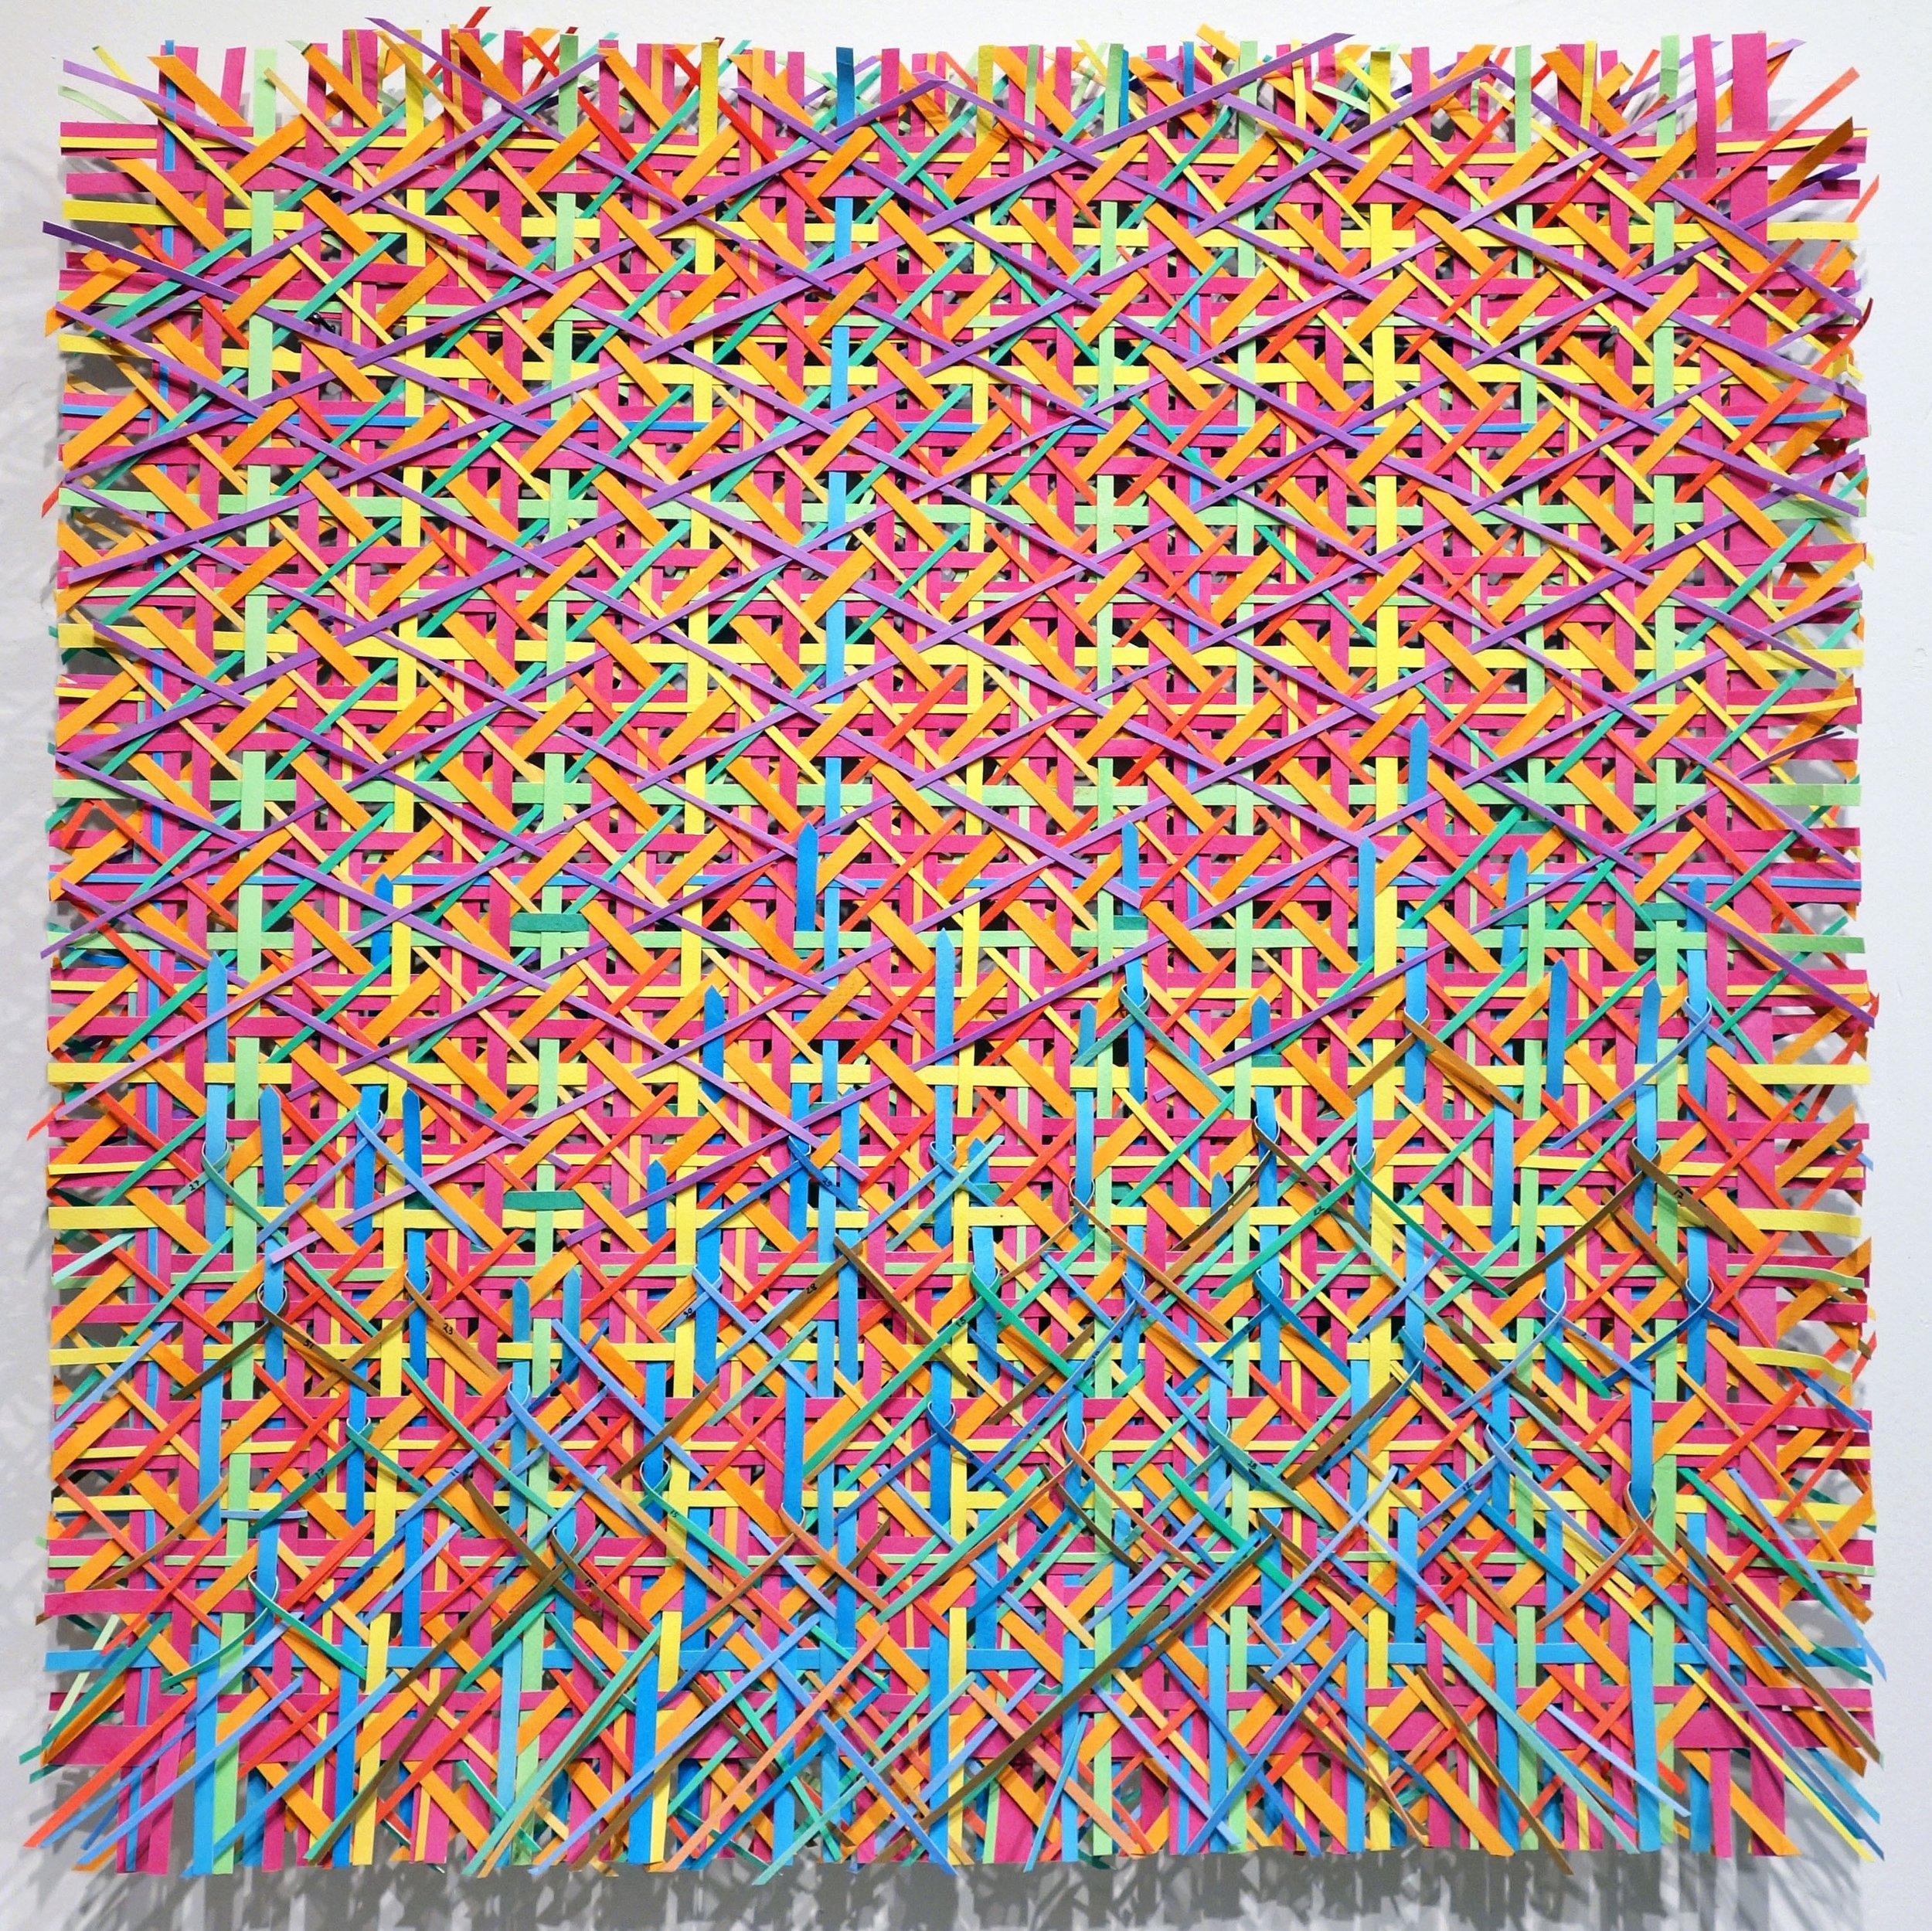
Jean / 2021 / Paper, string, data / 20”x20” / This piece is about grief during the pandemic, when saying goodbye to a loved one became a strange, disconnected and prolonged experience. I lost my mother-in-law during the worst Covid-19 wave in Boston, which was January 2021. The piece translates cloud cover, temperature and daily Covid-19 deaths in the US, during the month of January and the beginning of February.
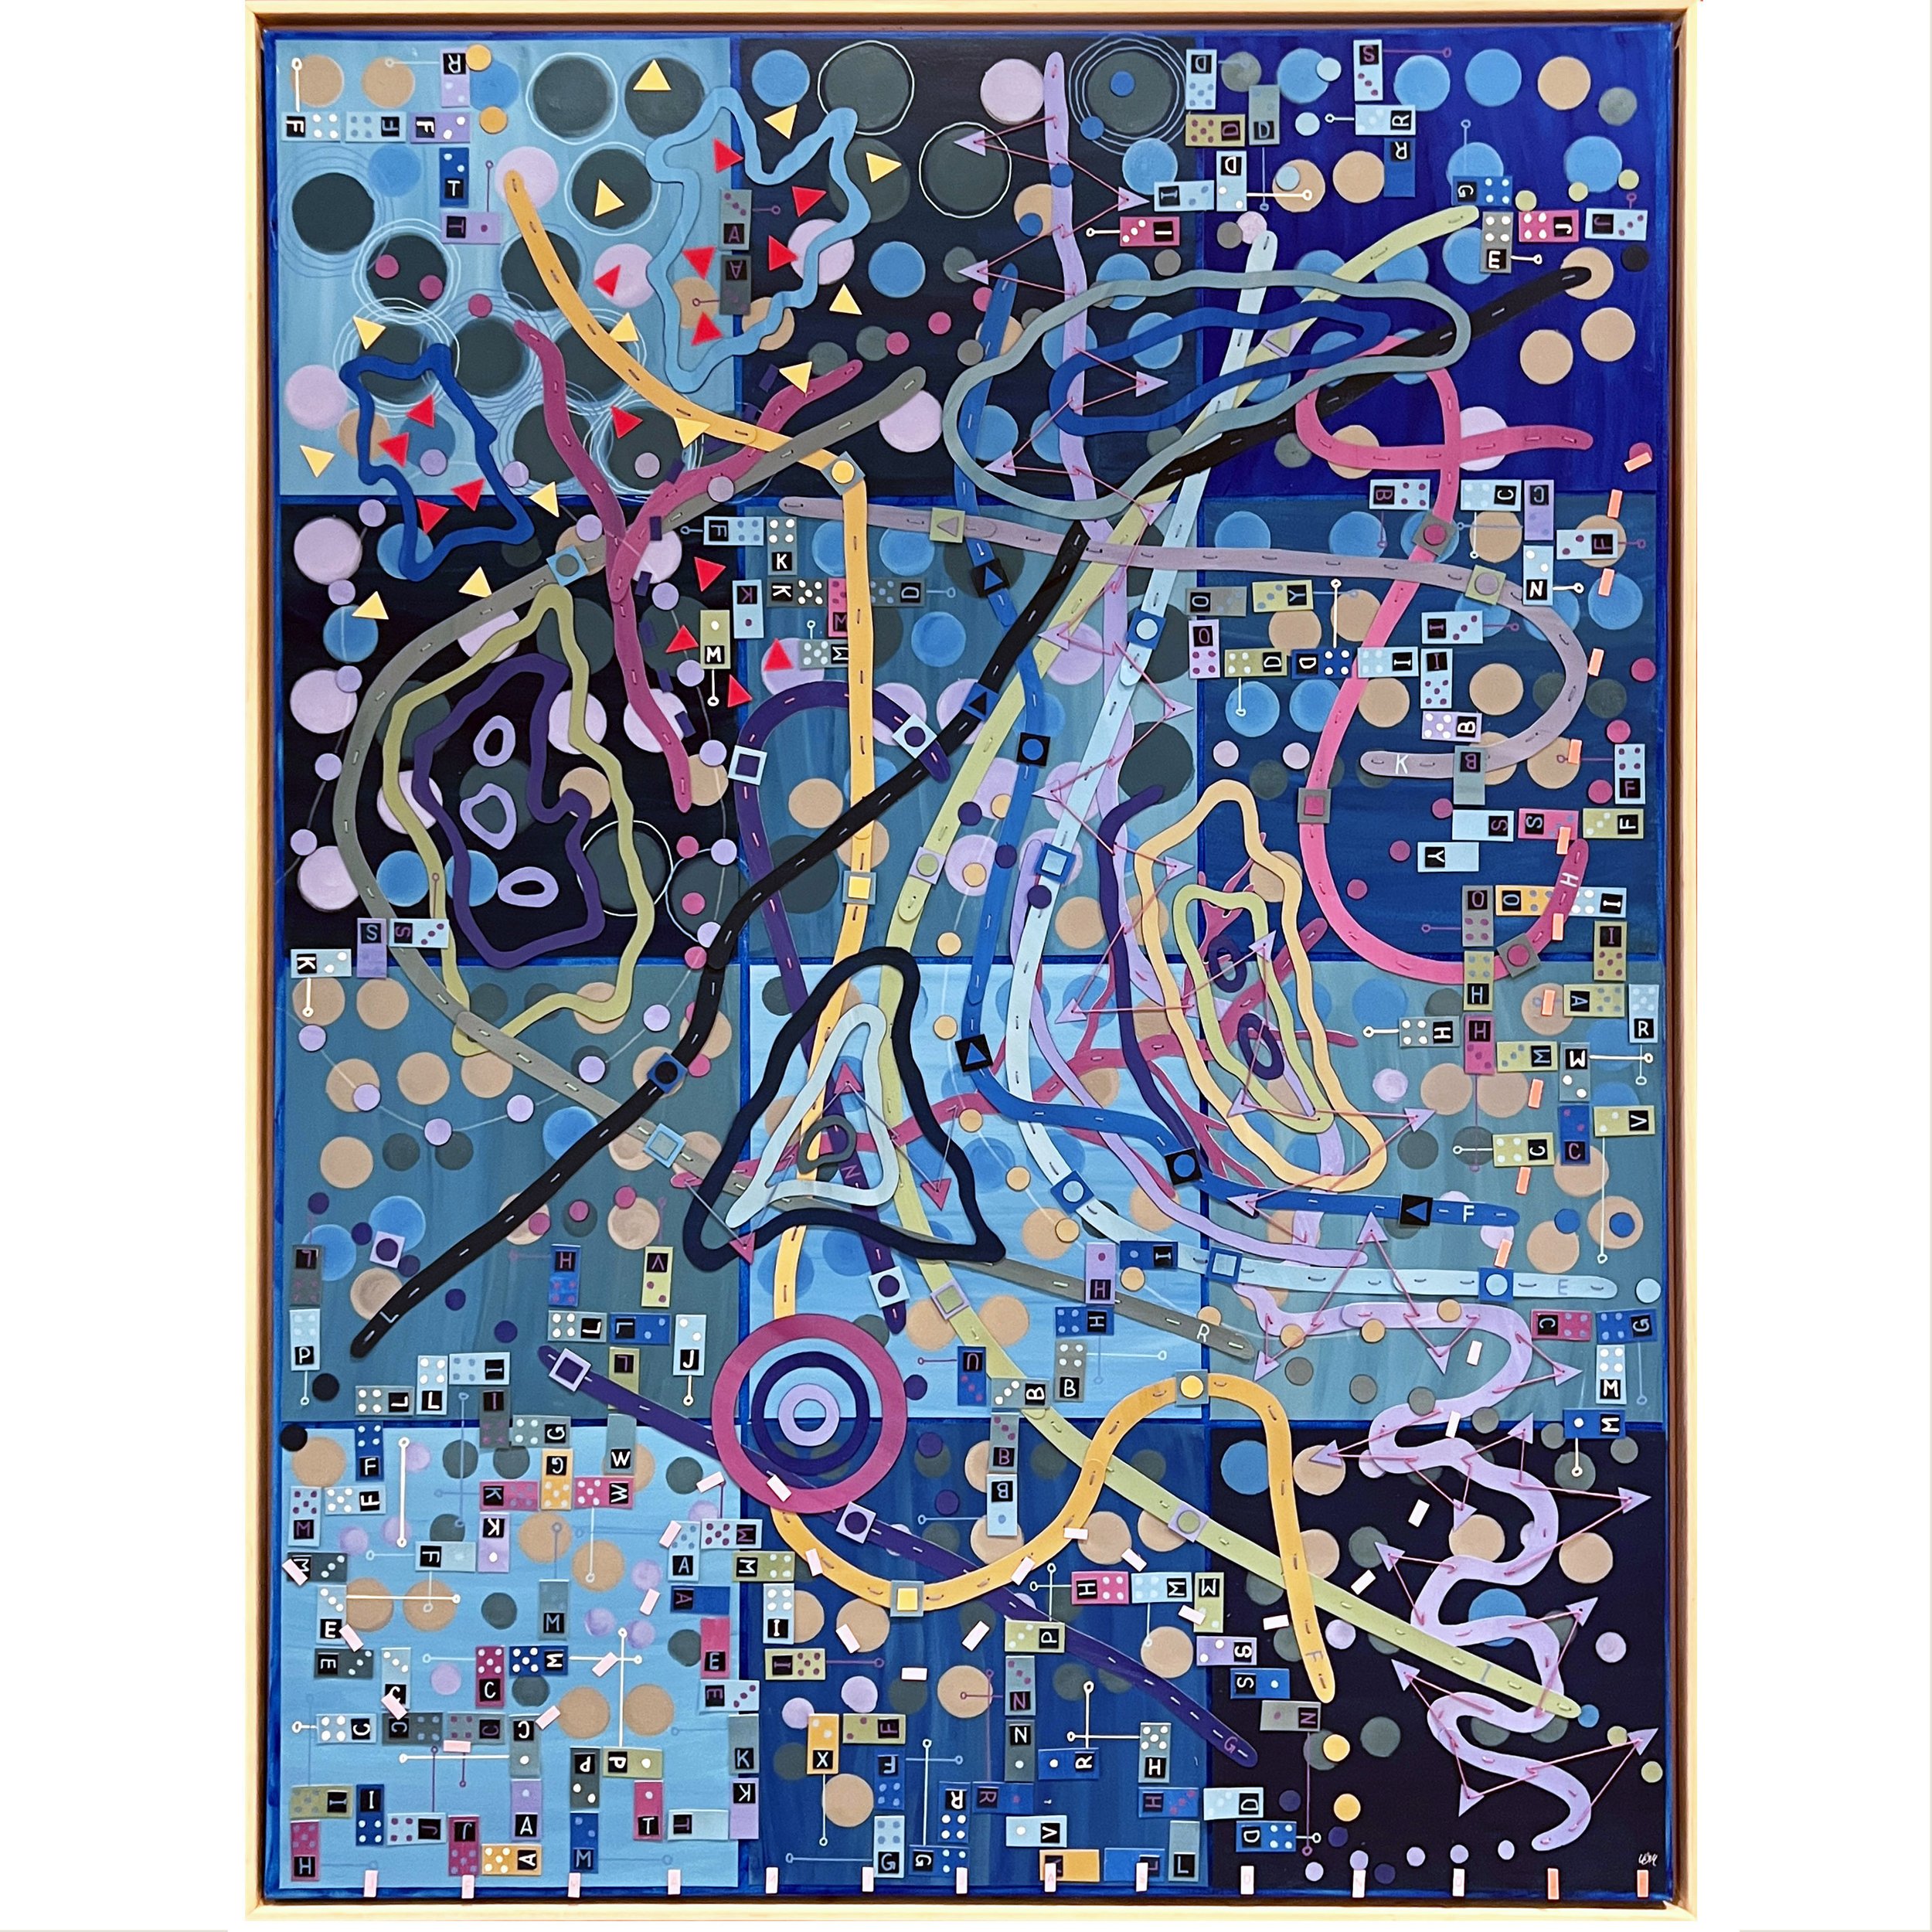
Patterns of Disasters / 2022 / Paper on canvas / 36” x 48” / This piece translates global COVID-19 data with major weather events of 2021. SOLD

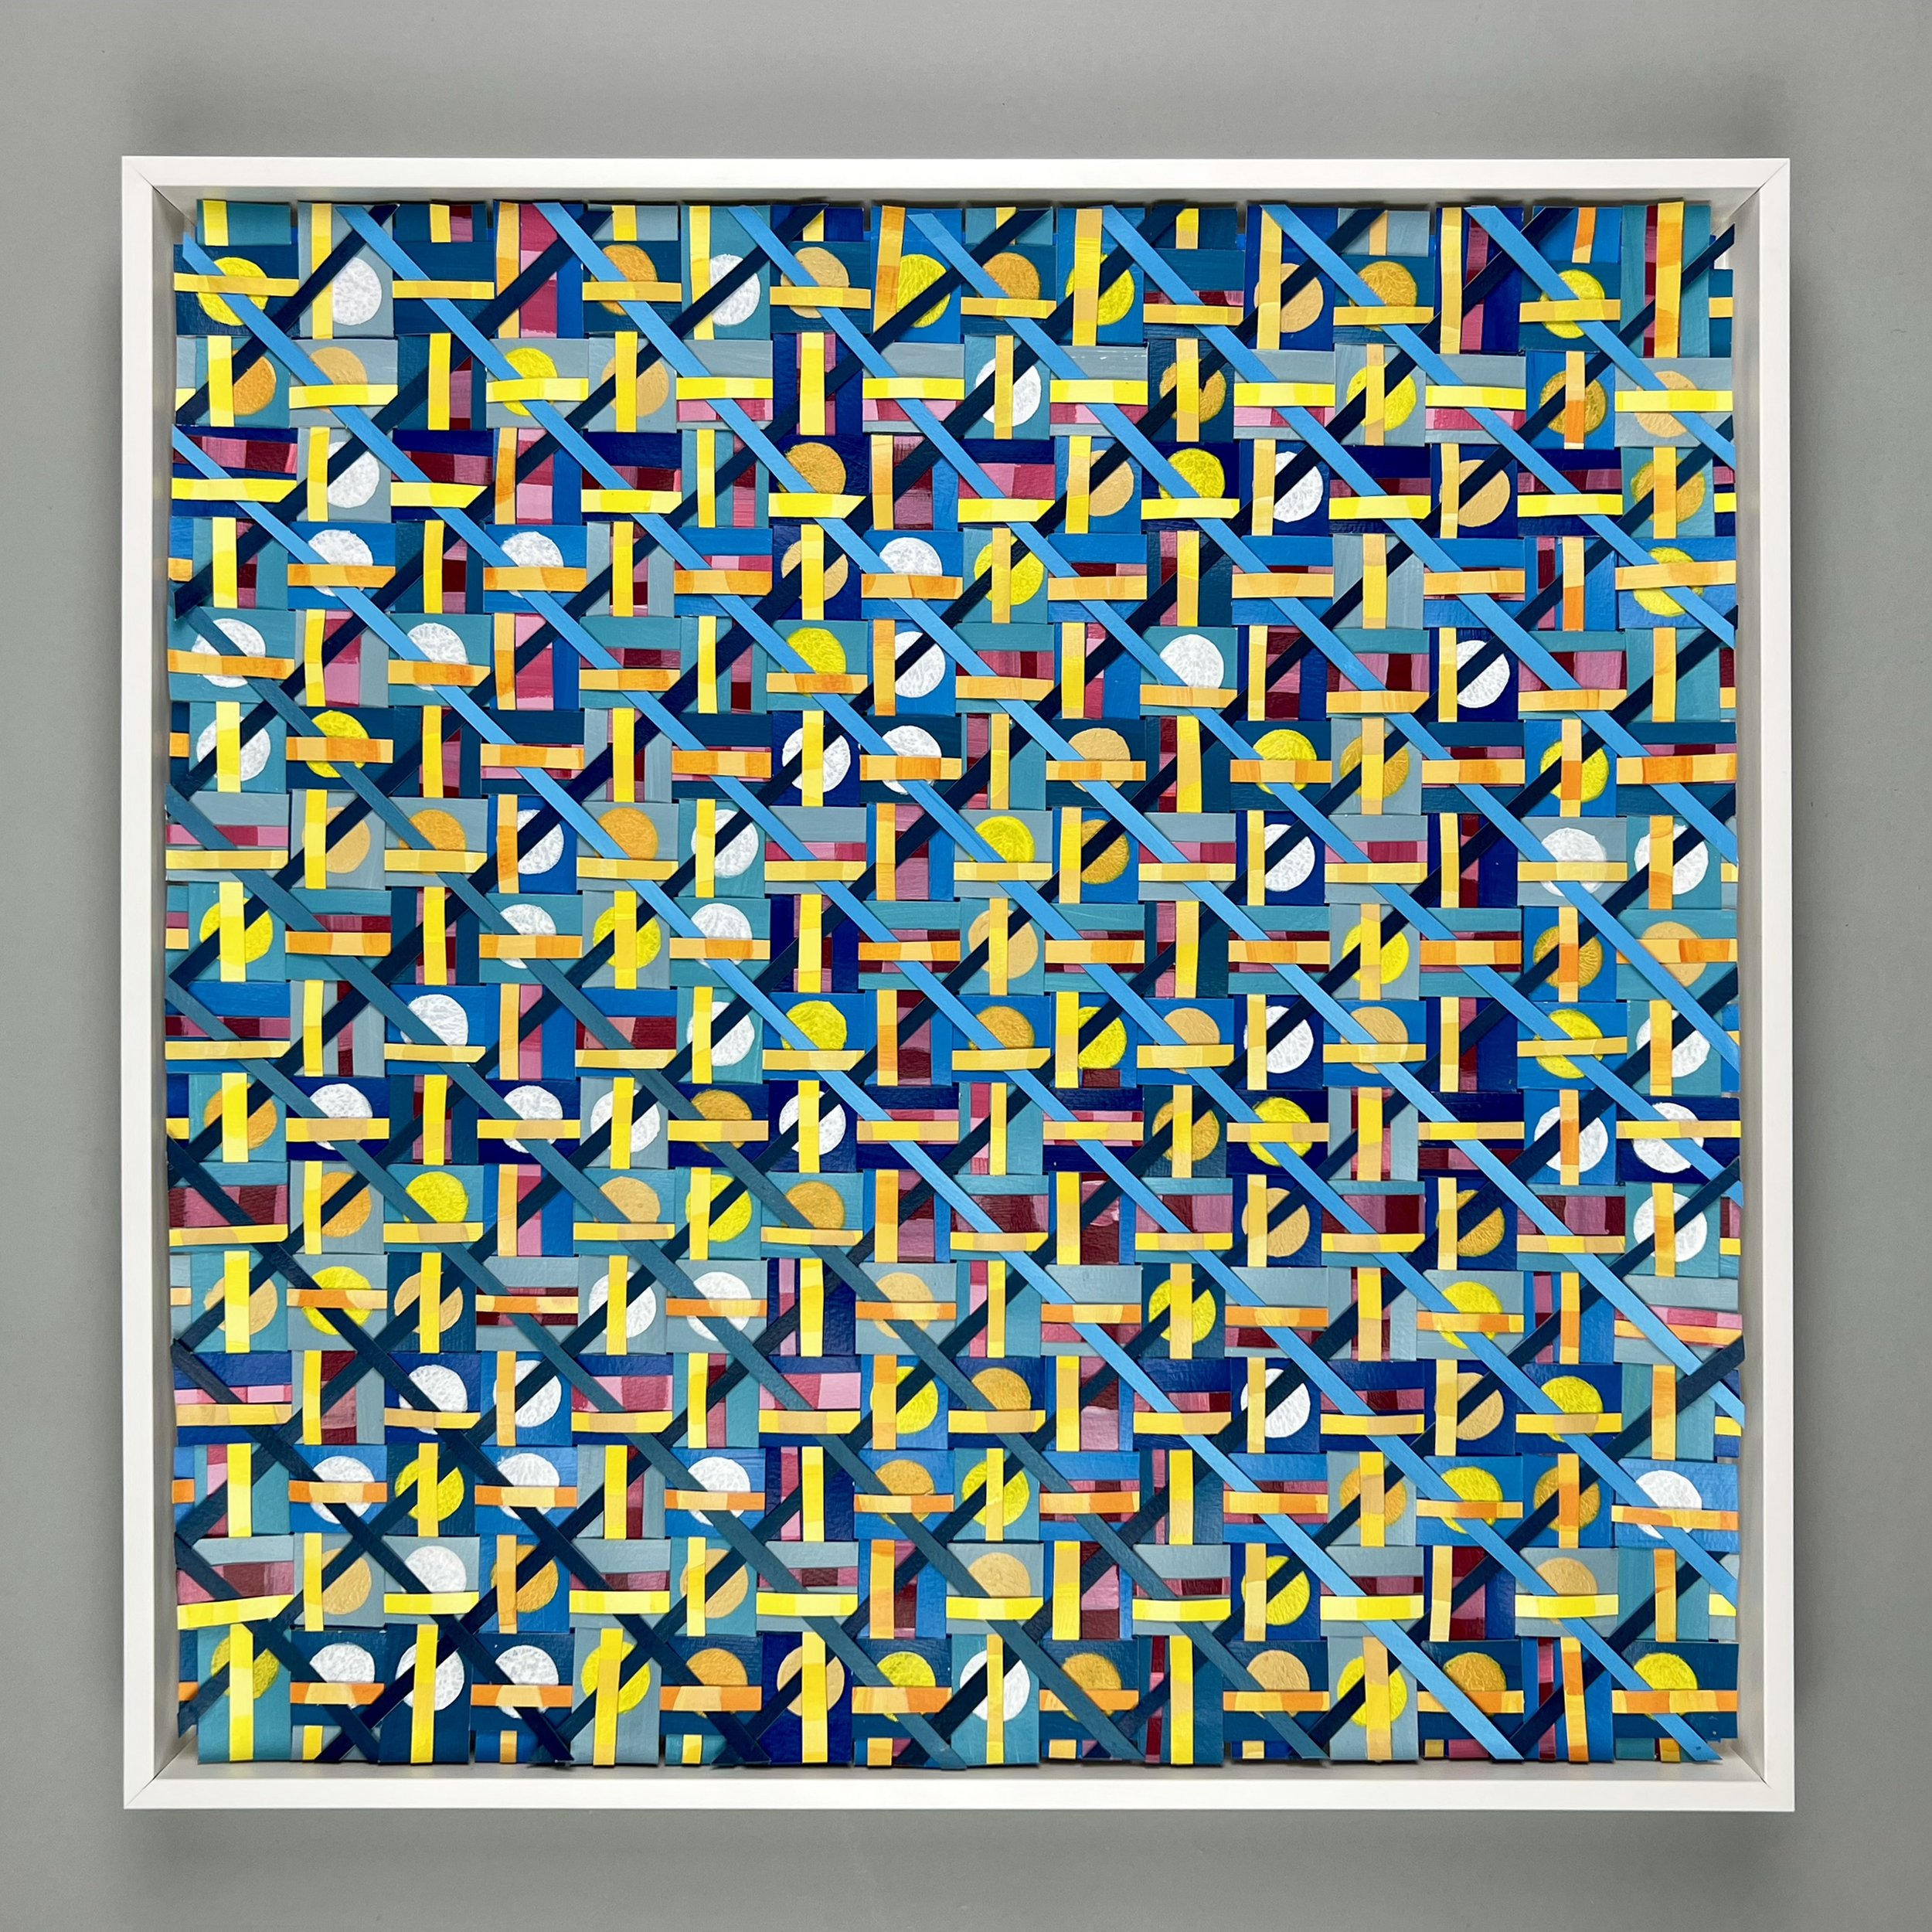
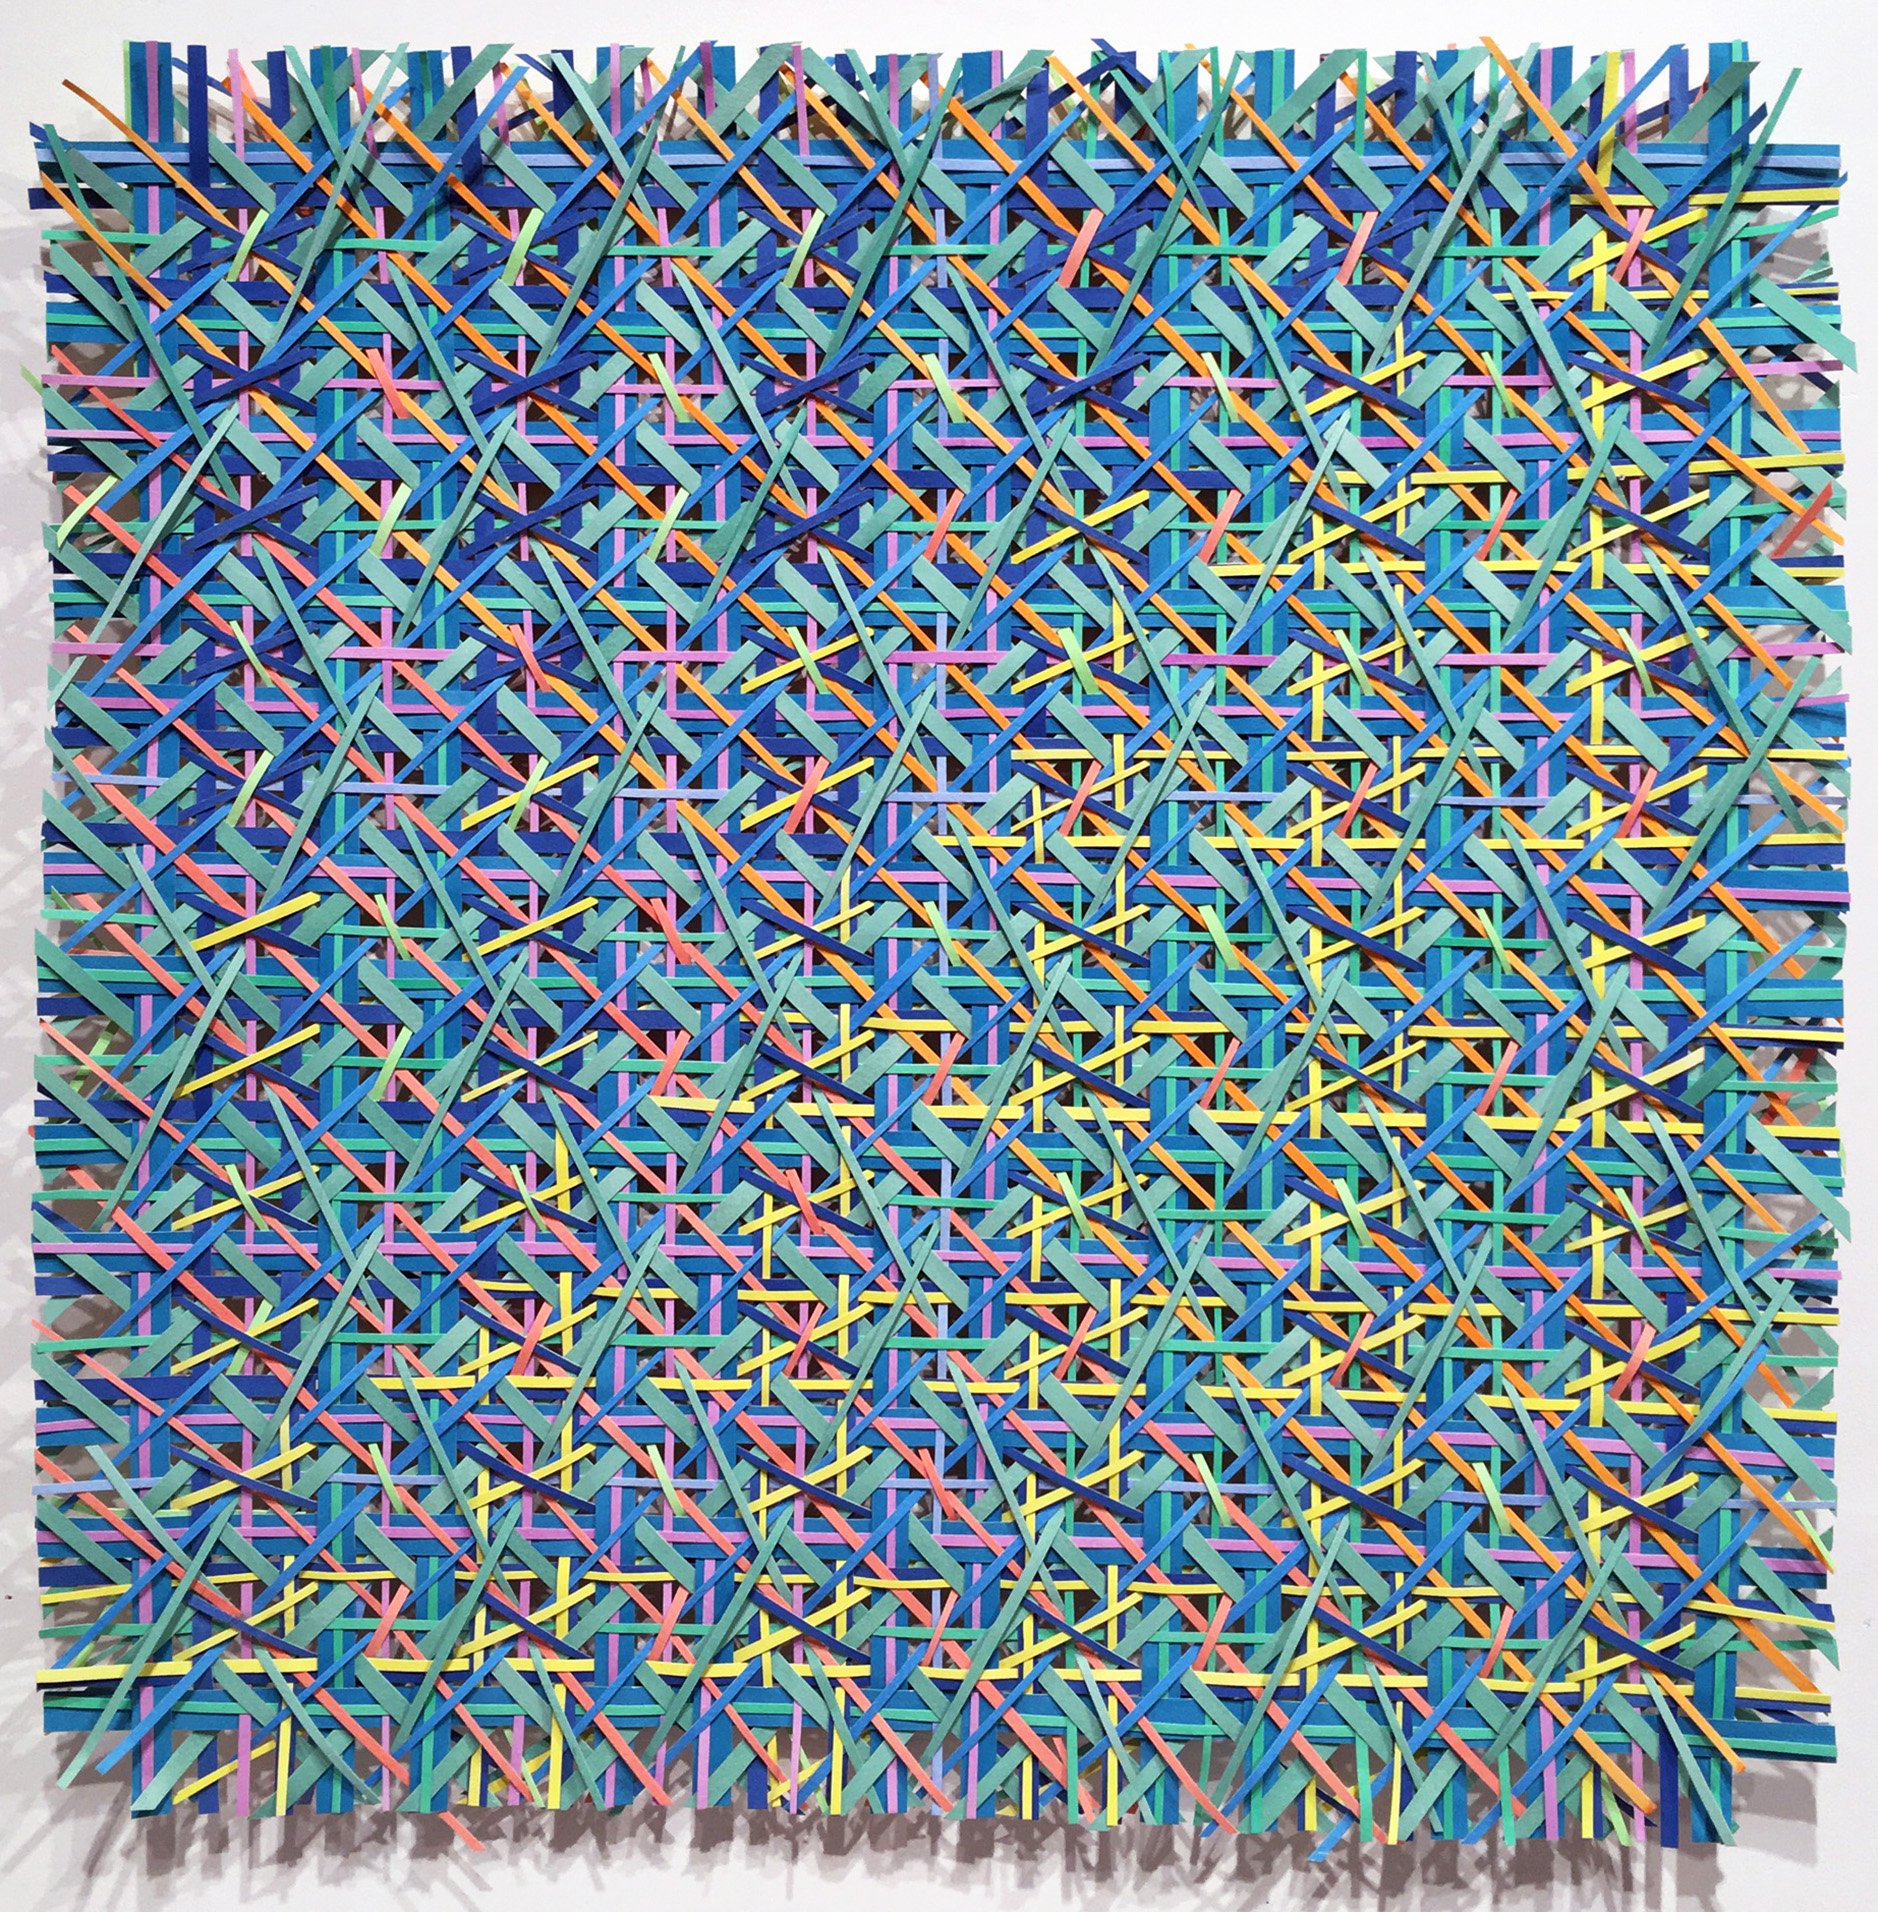
Comfort Zones / 2021 / Paper, string, data /20”x20” / This piece explores the outdoor temperature range that felt comfortable to wear a mask. Using data from Boston, this piece translates cloud cover, temperature (March 2020-Jan 2021), solar azimuth for 2020 and Covid-19 death rates every 15th of the month from April ’20 to Sept’21.
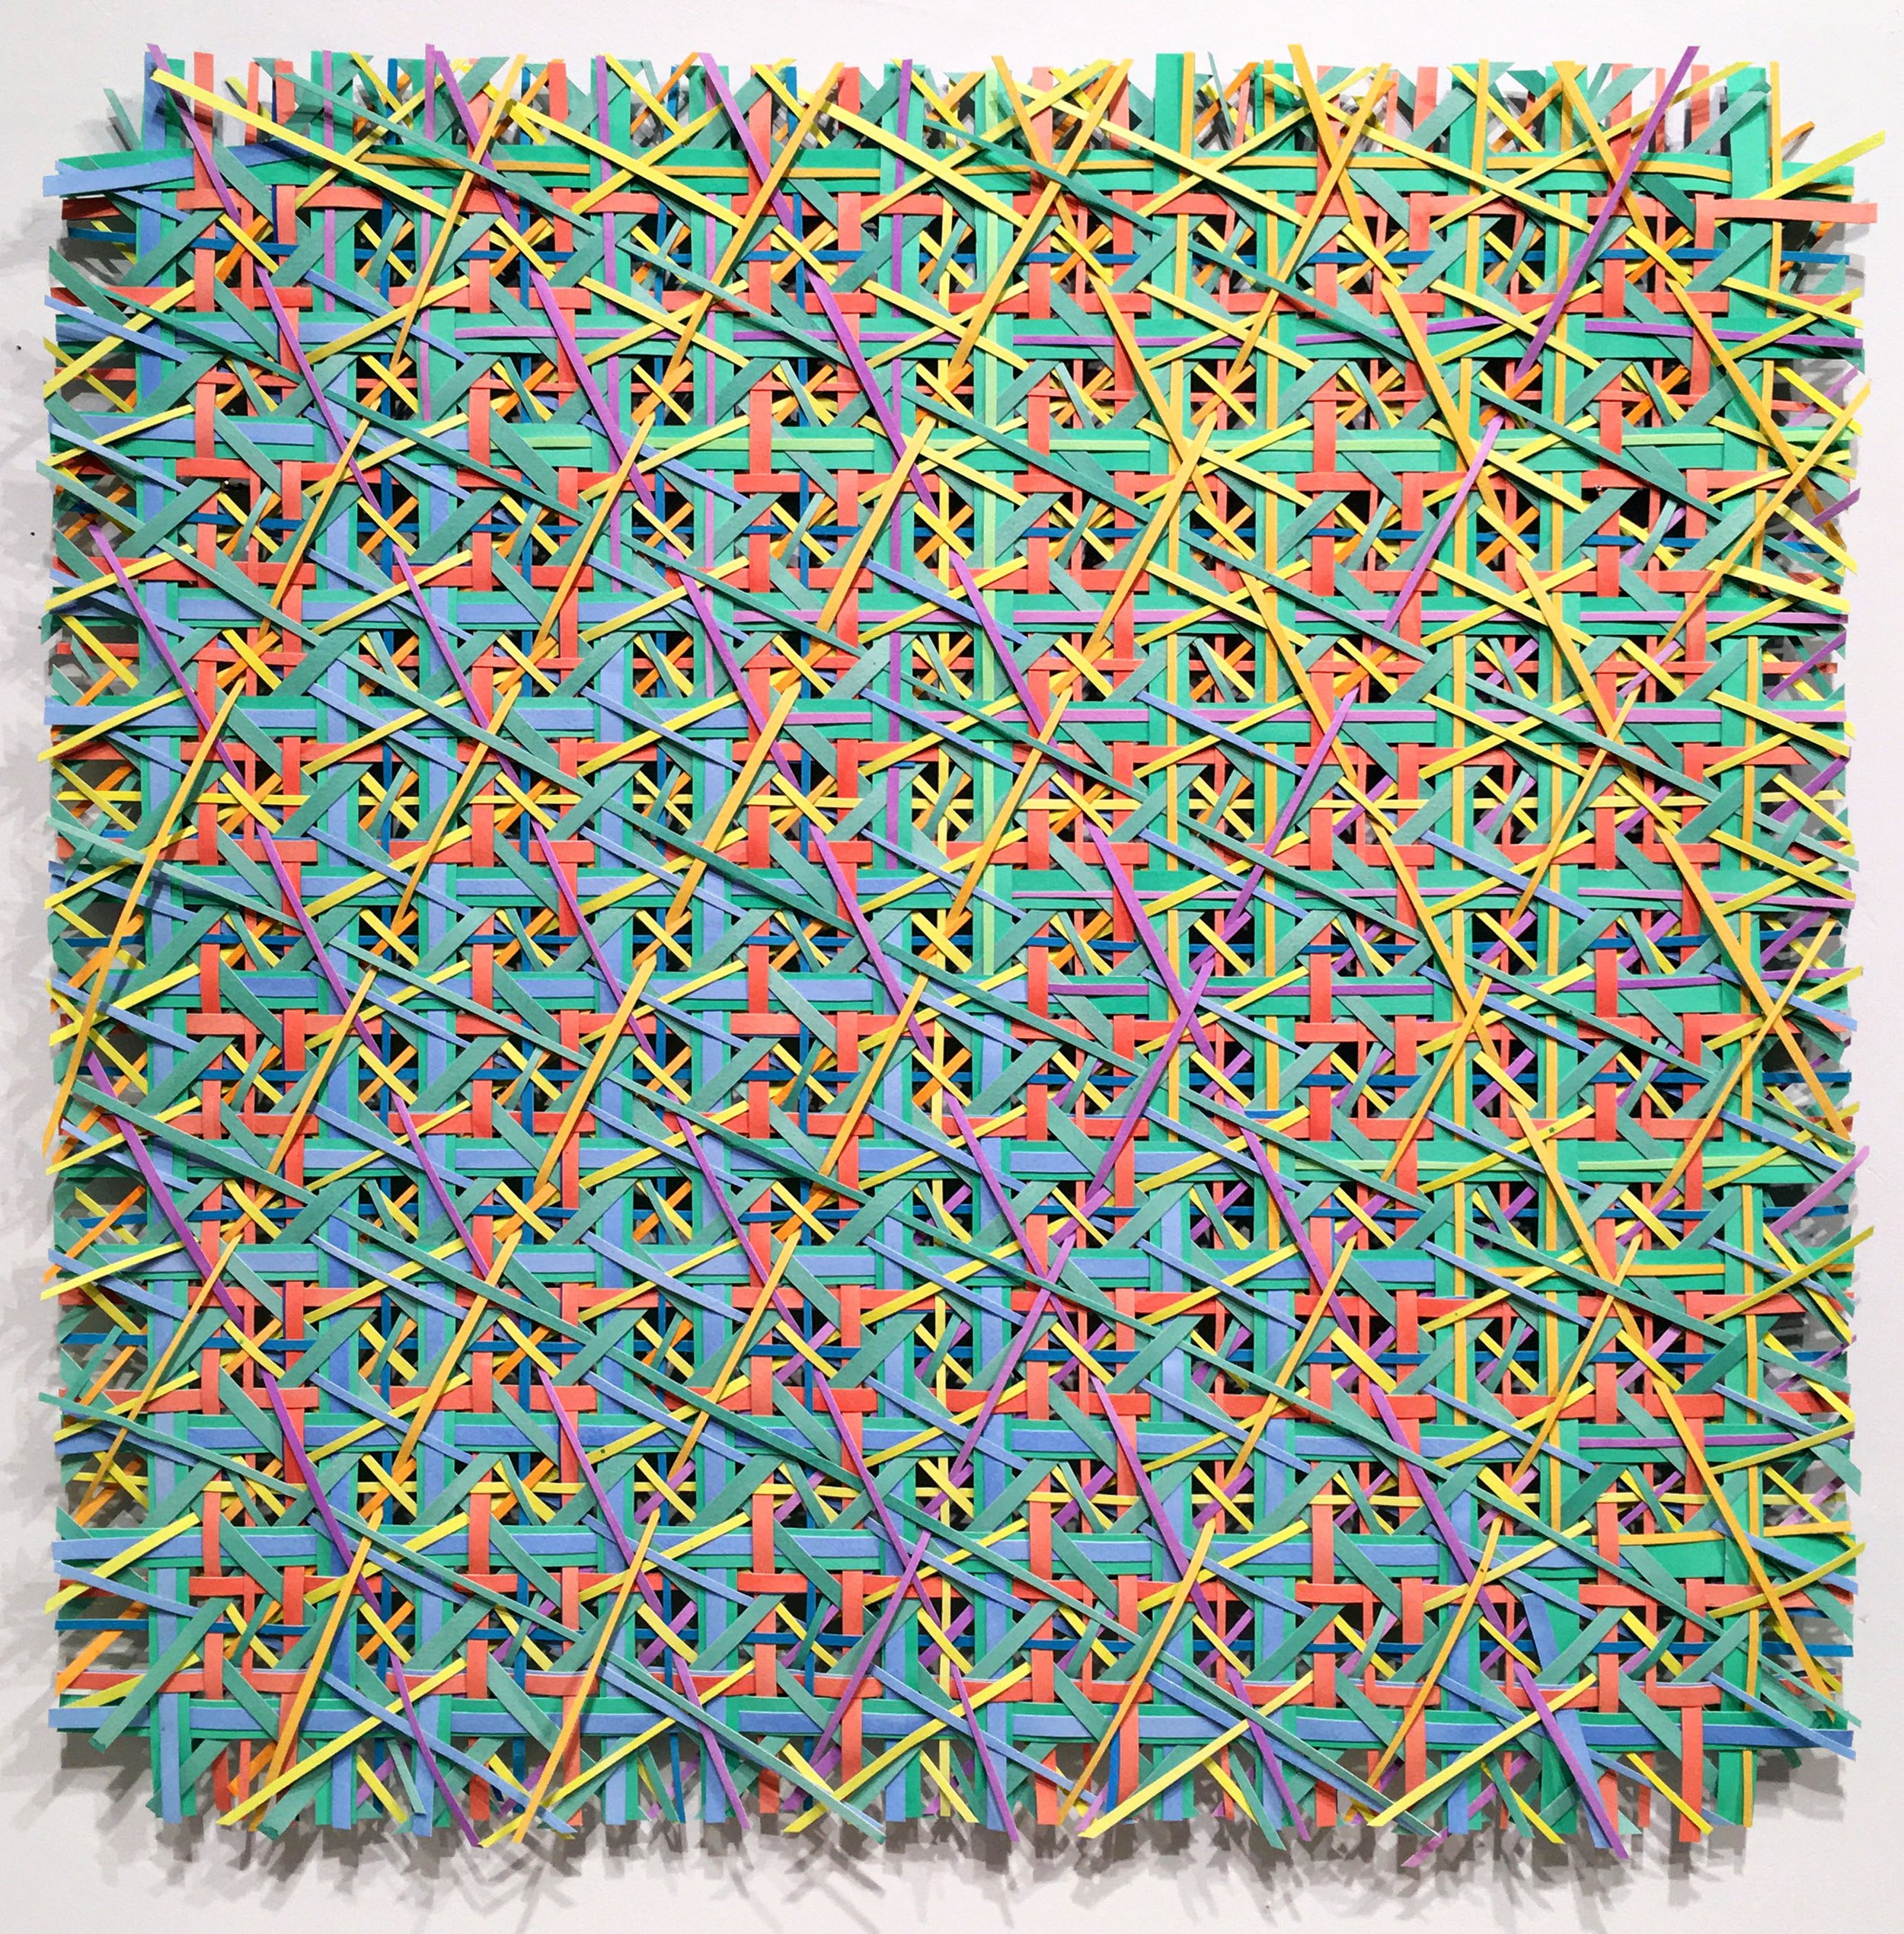
Mason Square / 2021 / Paper, string, data / 20”x20” / Mason Square is a public park near my apartment. During the worst of 2020, it became a kind of physical and psychological refuge. It translates cloud cover, temperature and moon phases of the times I went there during the pandemic. SOLD
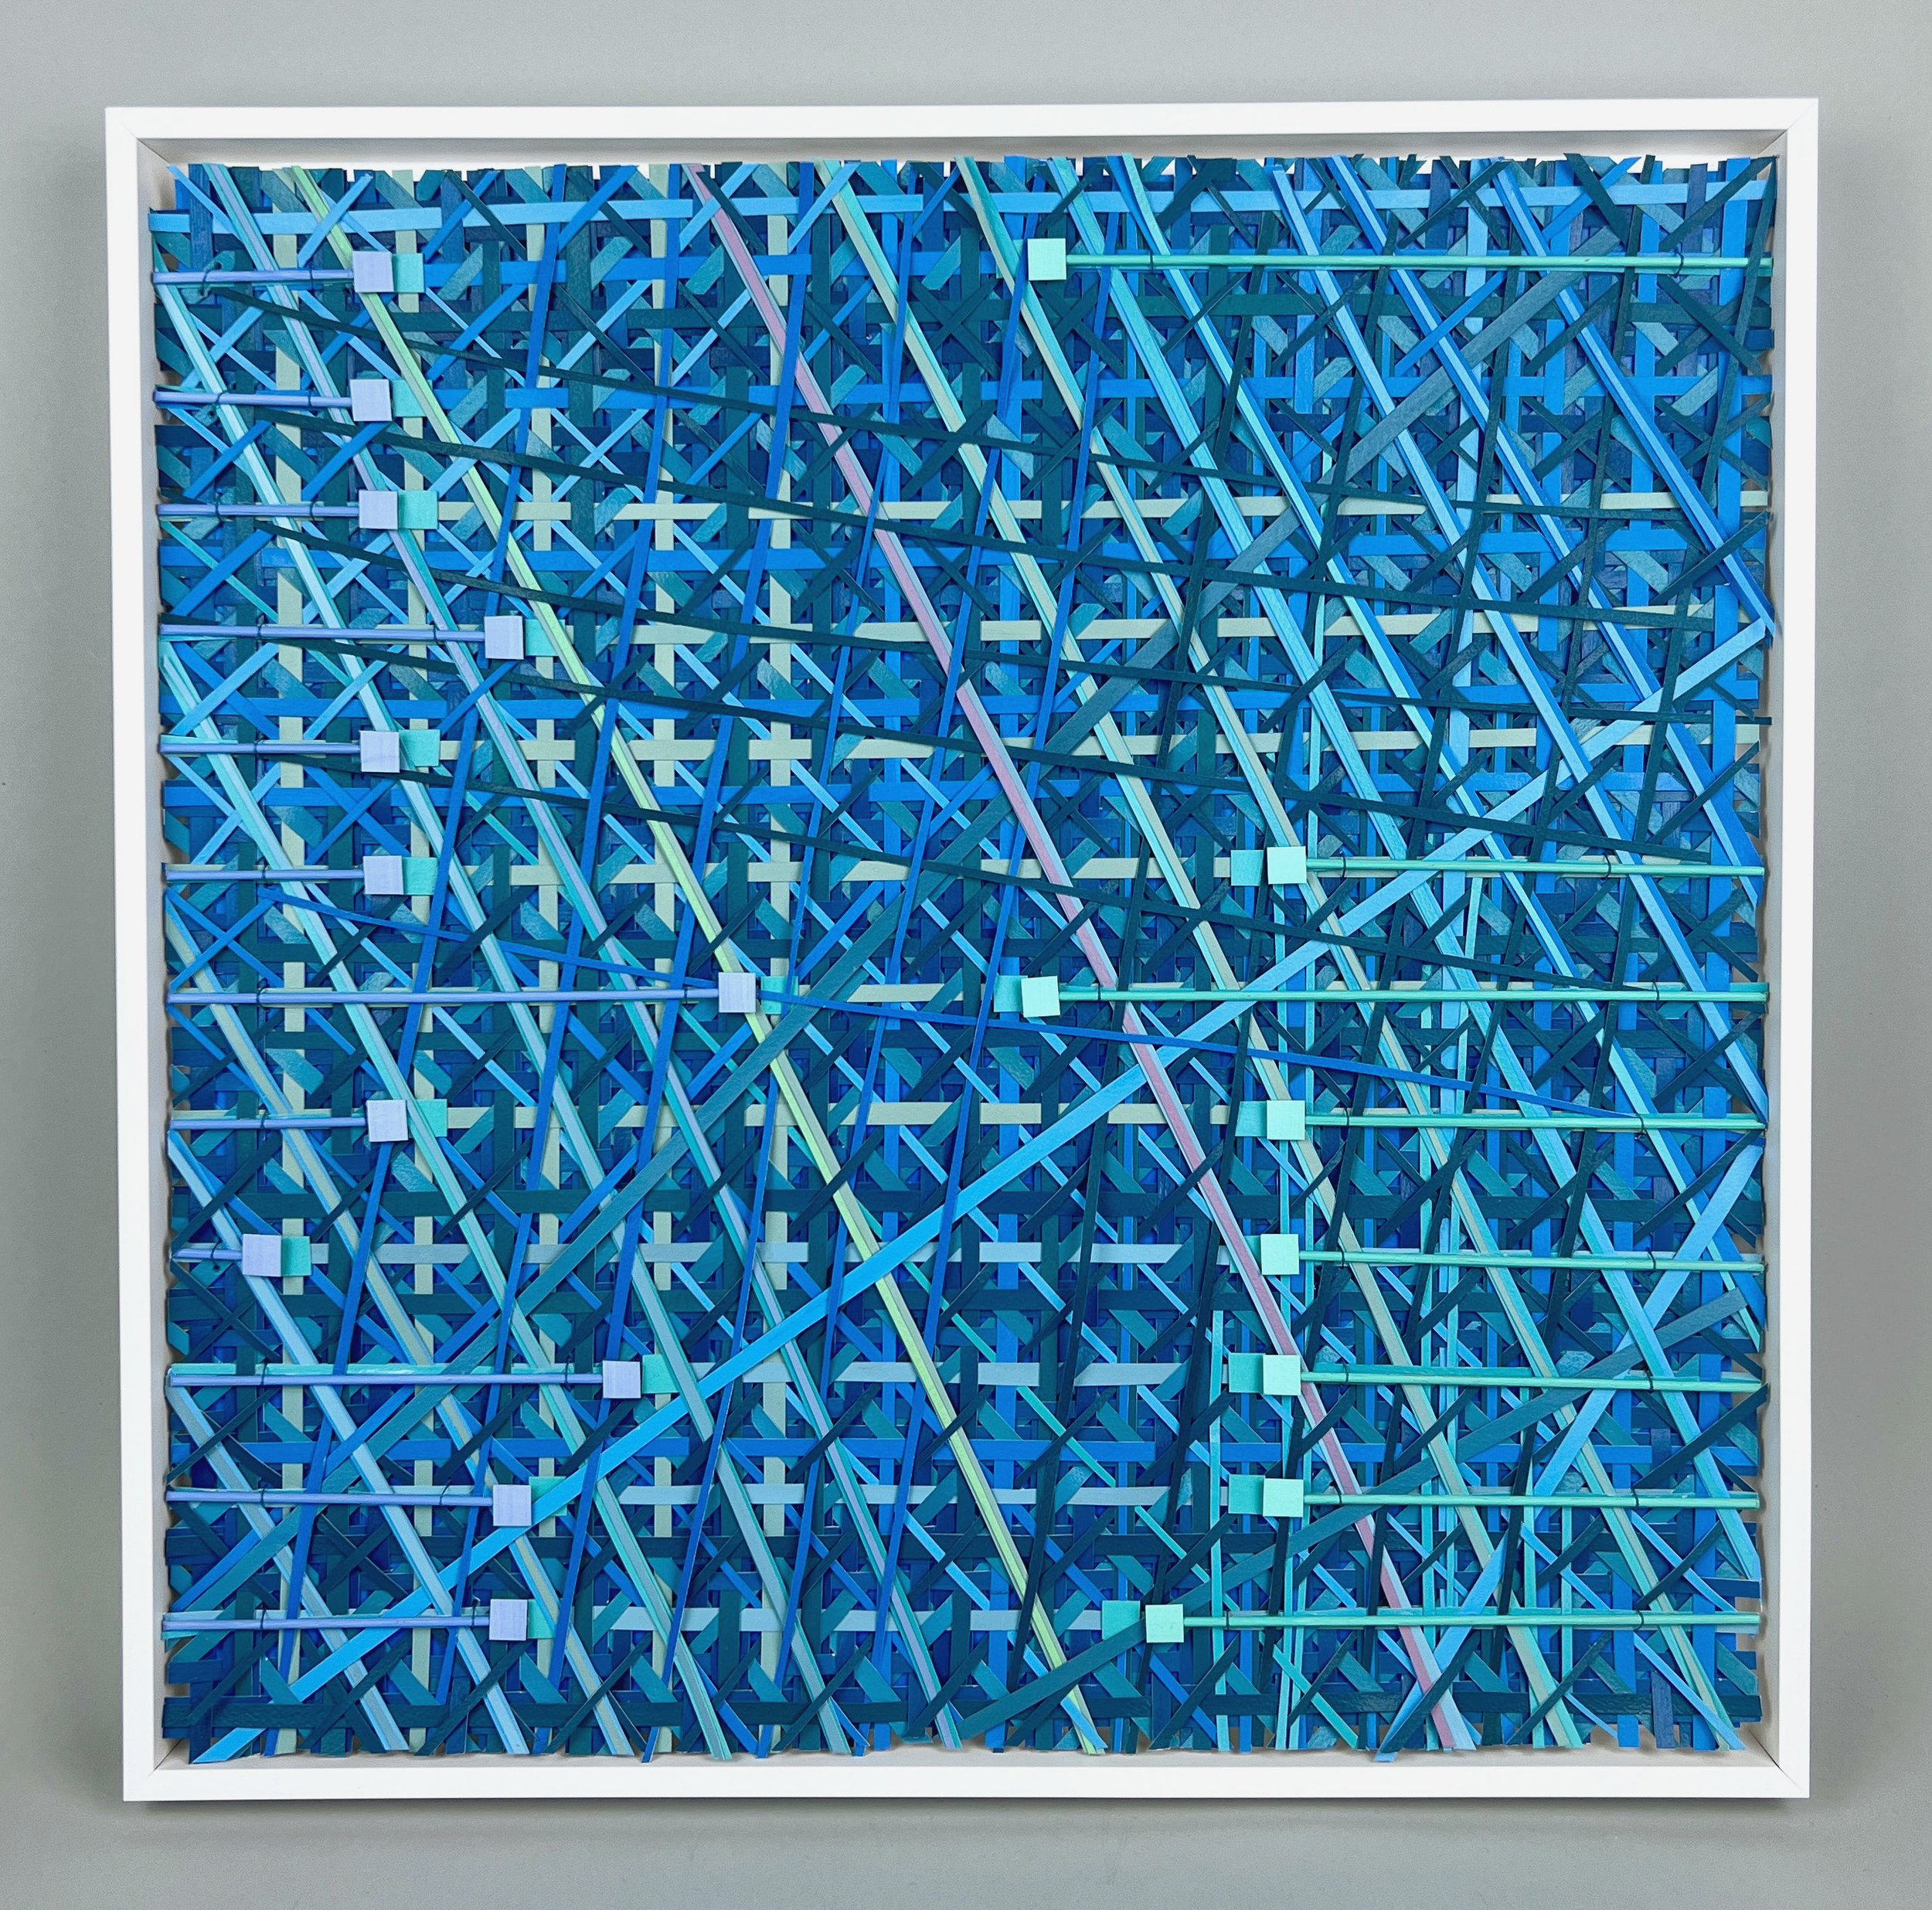
Sunny Days / 2021 / Paper, string, data / 20”x20” / During the pandemic, I became very aware of how much I loved the chance of being outside. This piece explores how my relationship with cloud cover changed before and after I was vaccinated. It translates cloud cover and temperature from March, as well as my vaccination cycle. SOLD
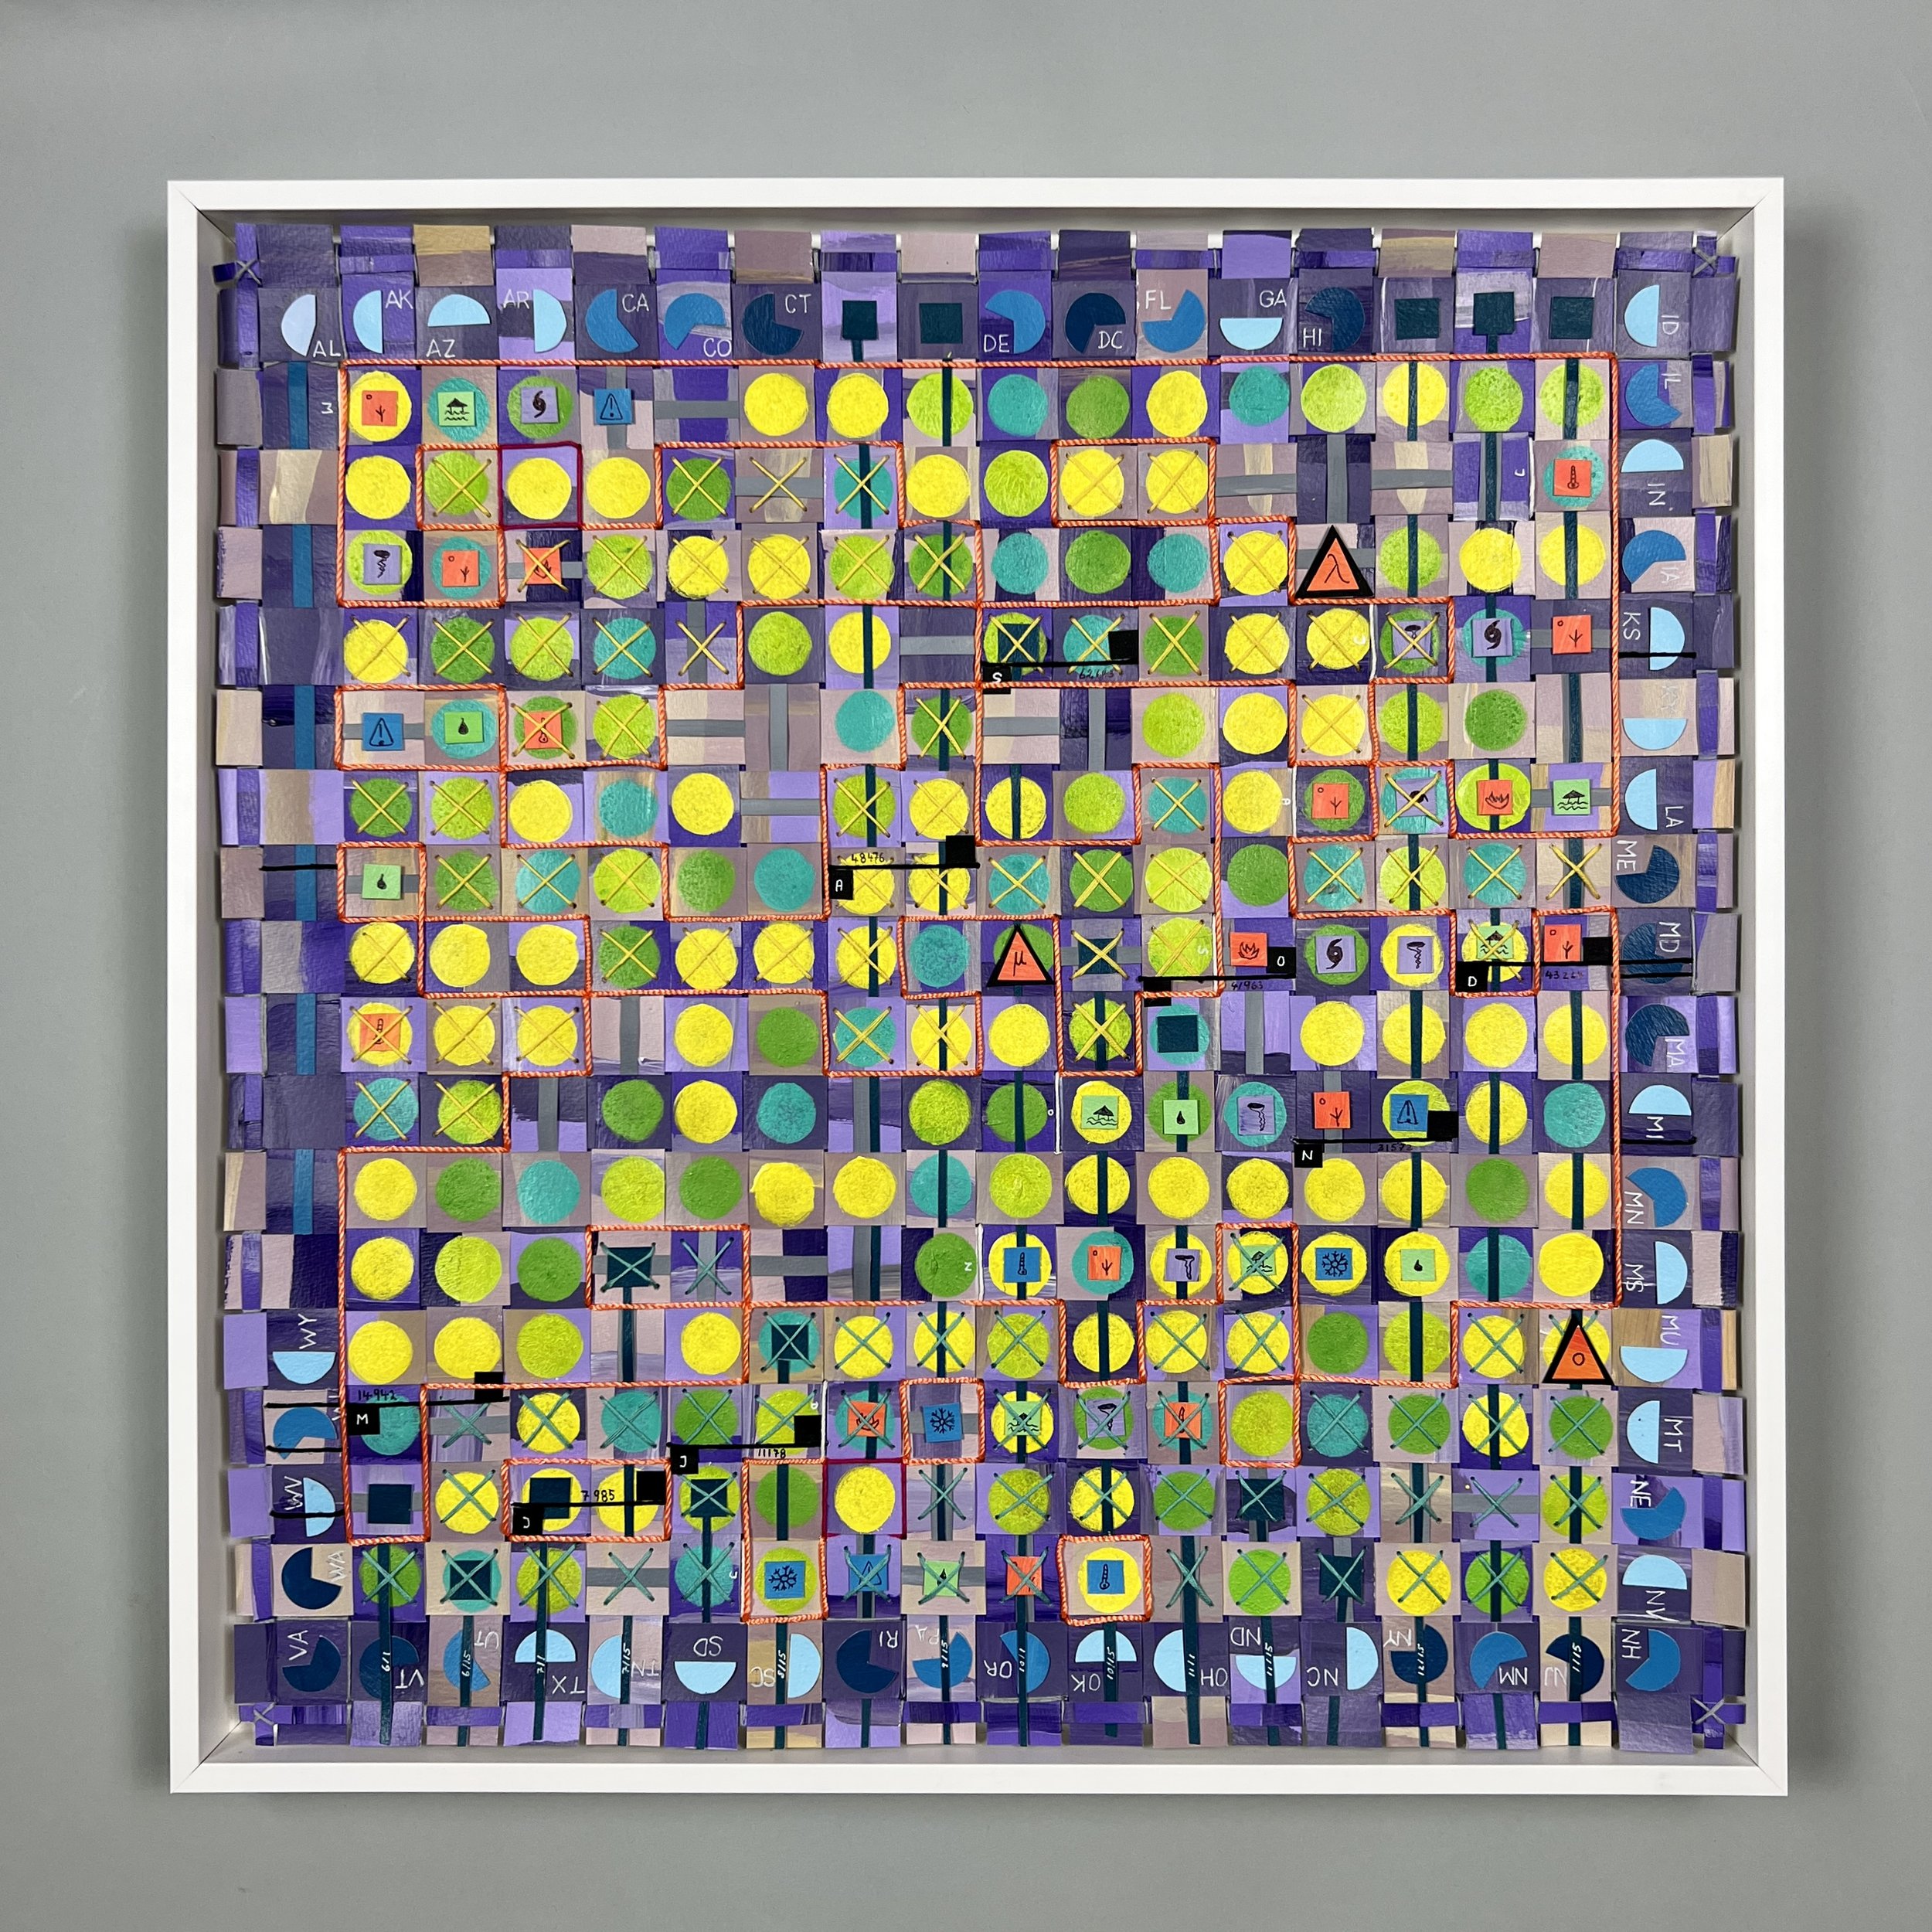
Comfort Zones II / 2022/ Paper, string, data / 20”x20” / This piece explores the temperature range outdoors that was comfortable to me while having to wear a mask. Using data from Boston, this piece translates data from May ’21 - Jan’22: cloud cover, temperature, vaccination status of every state as of Feb ’22, monthly weather anomalies, Covid-19 variants, and US Covid-19 infection and death rates.

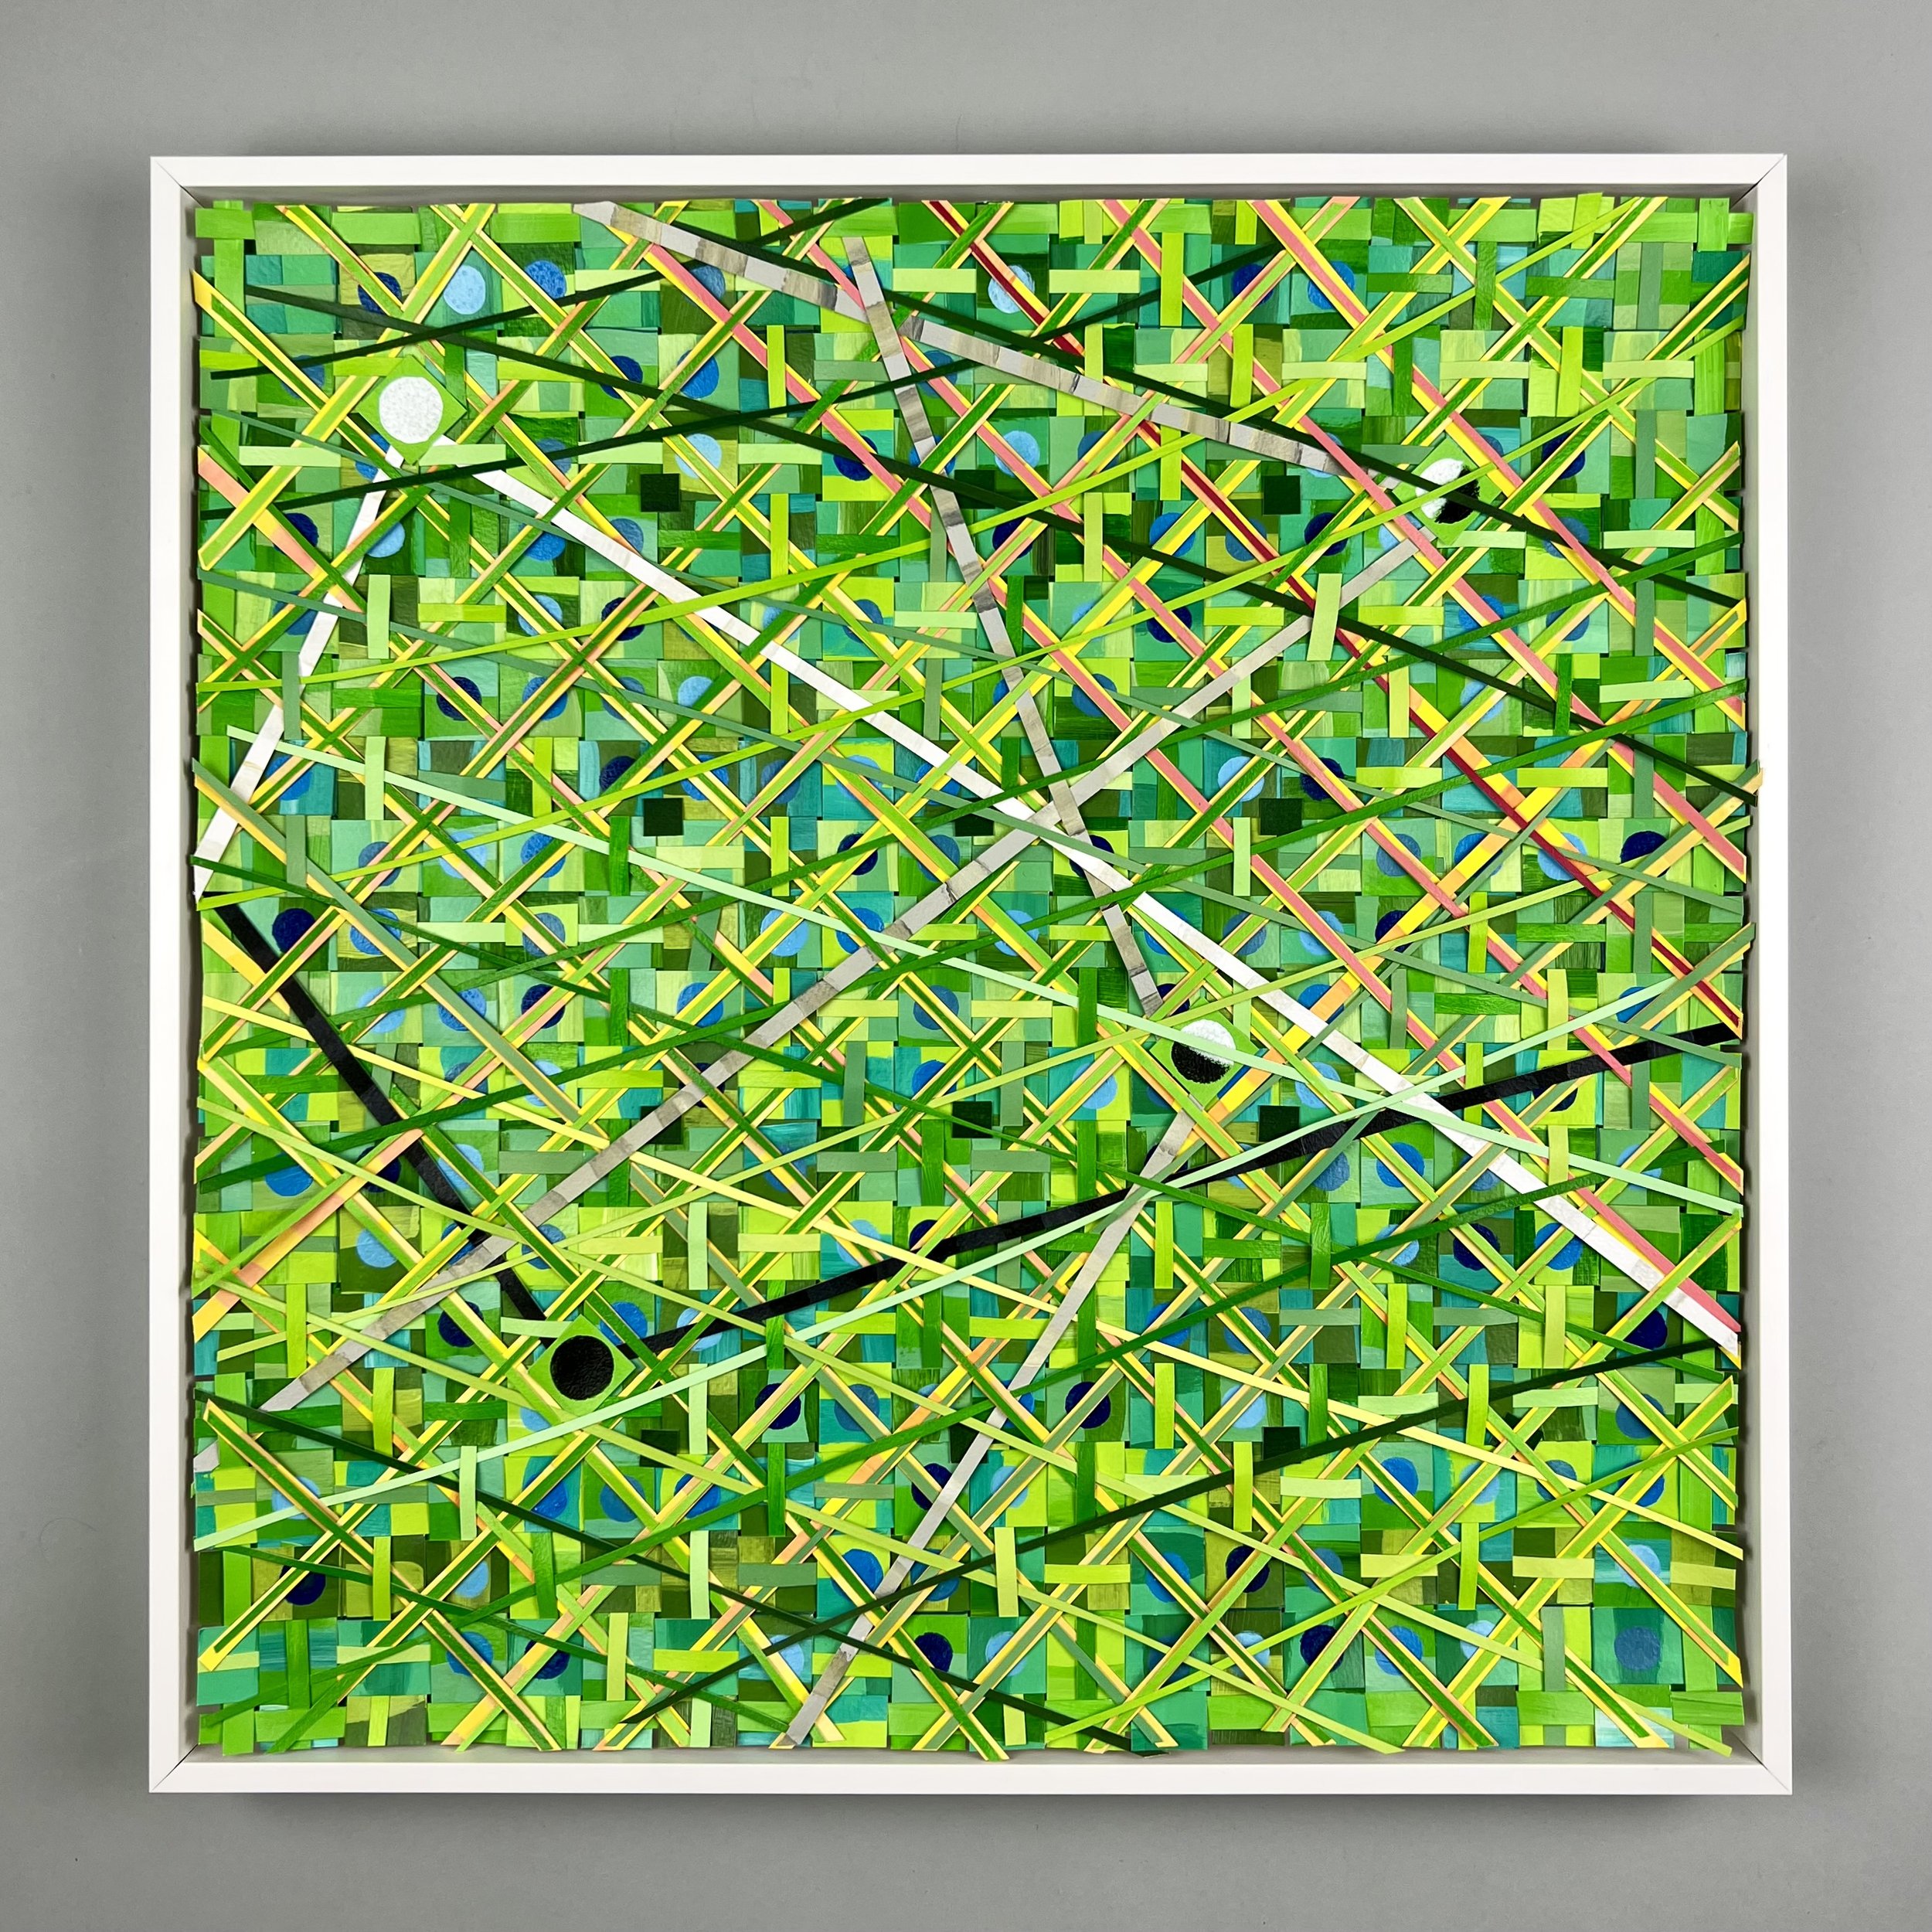
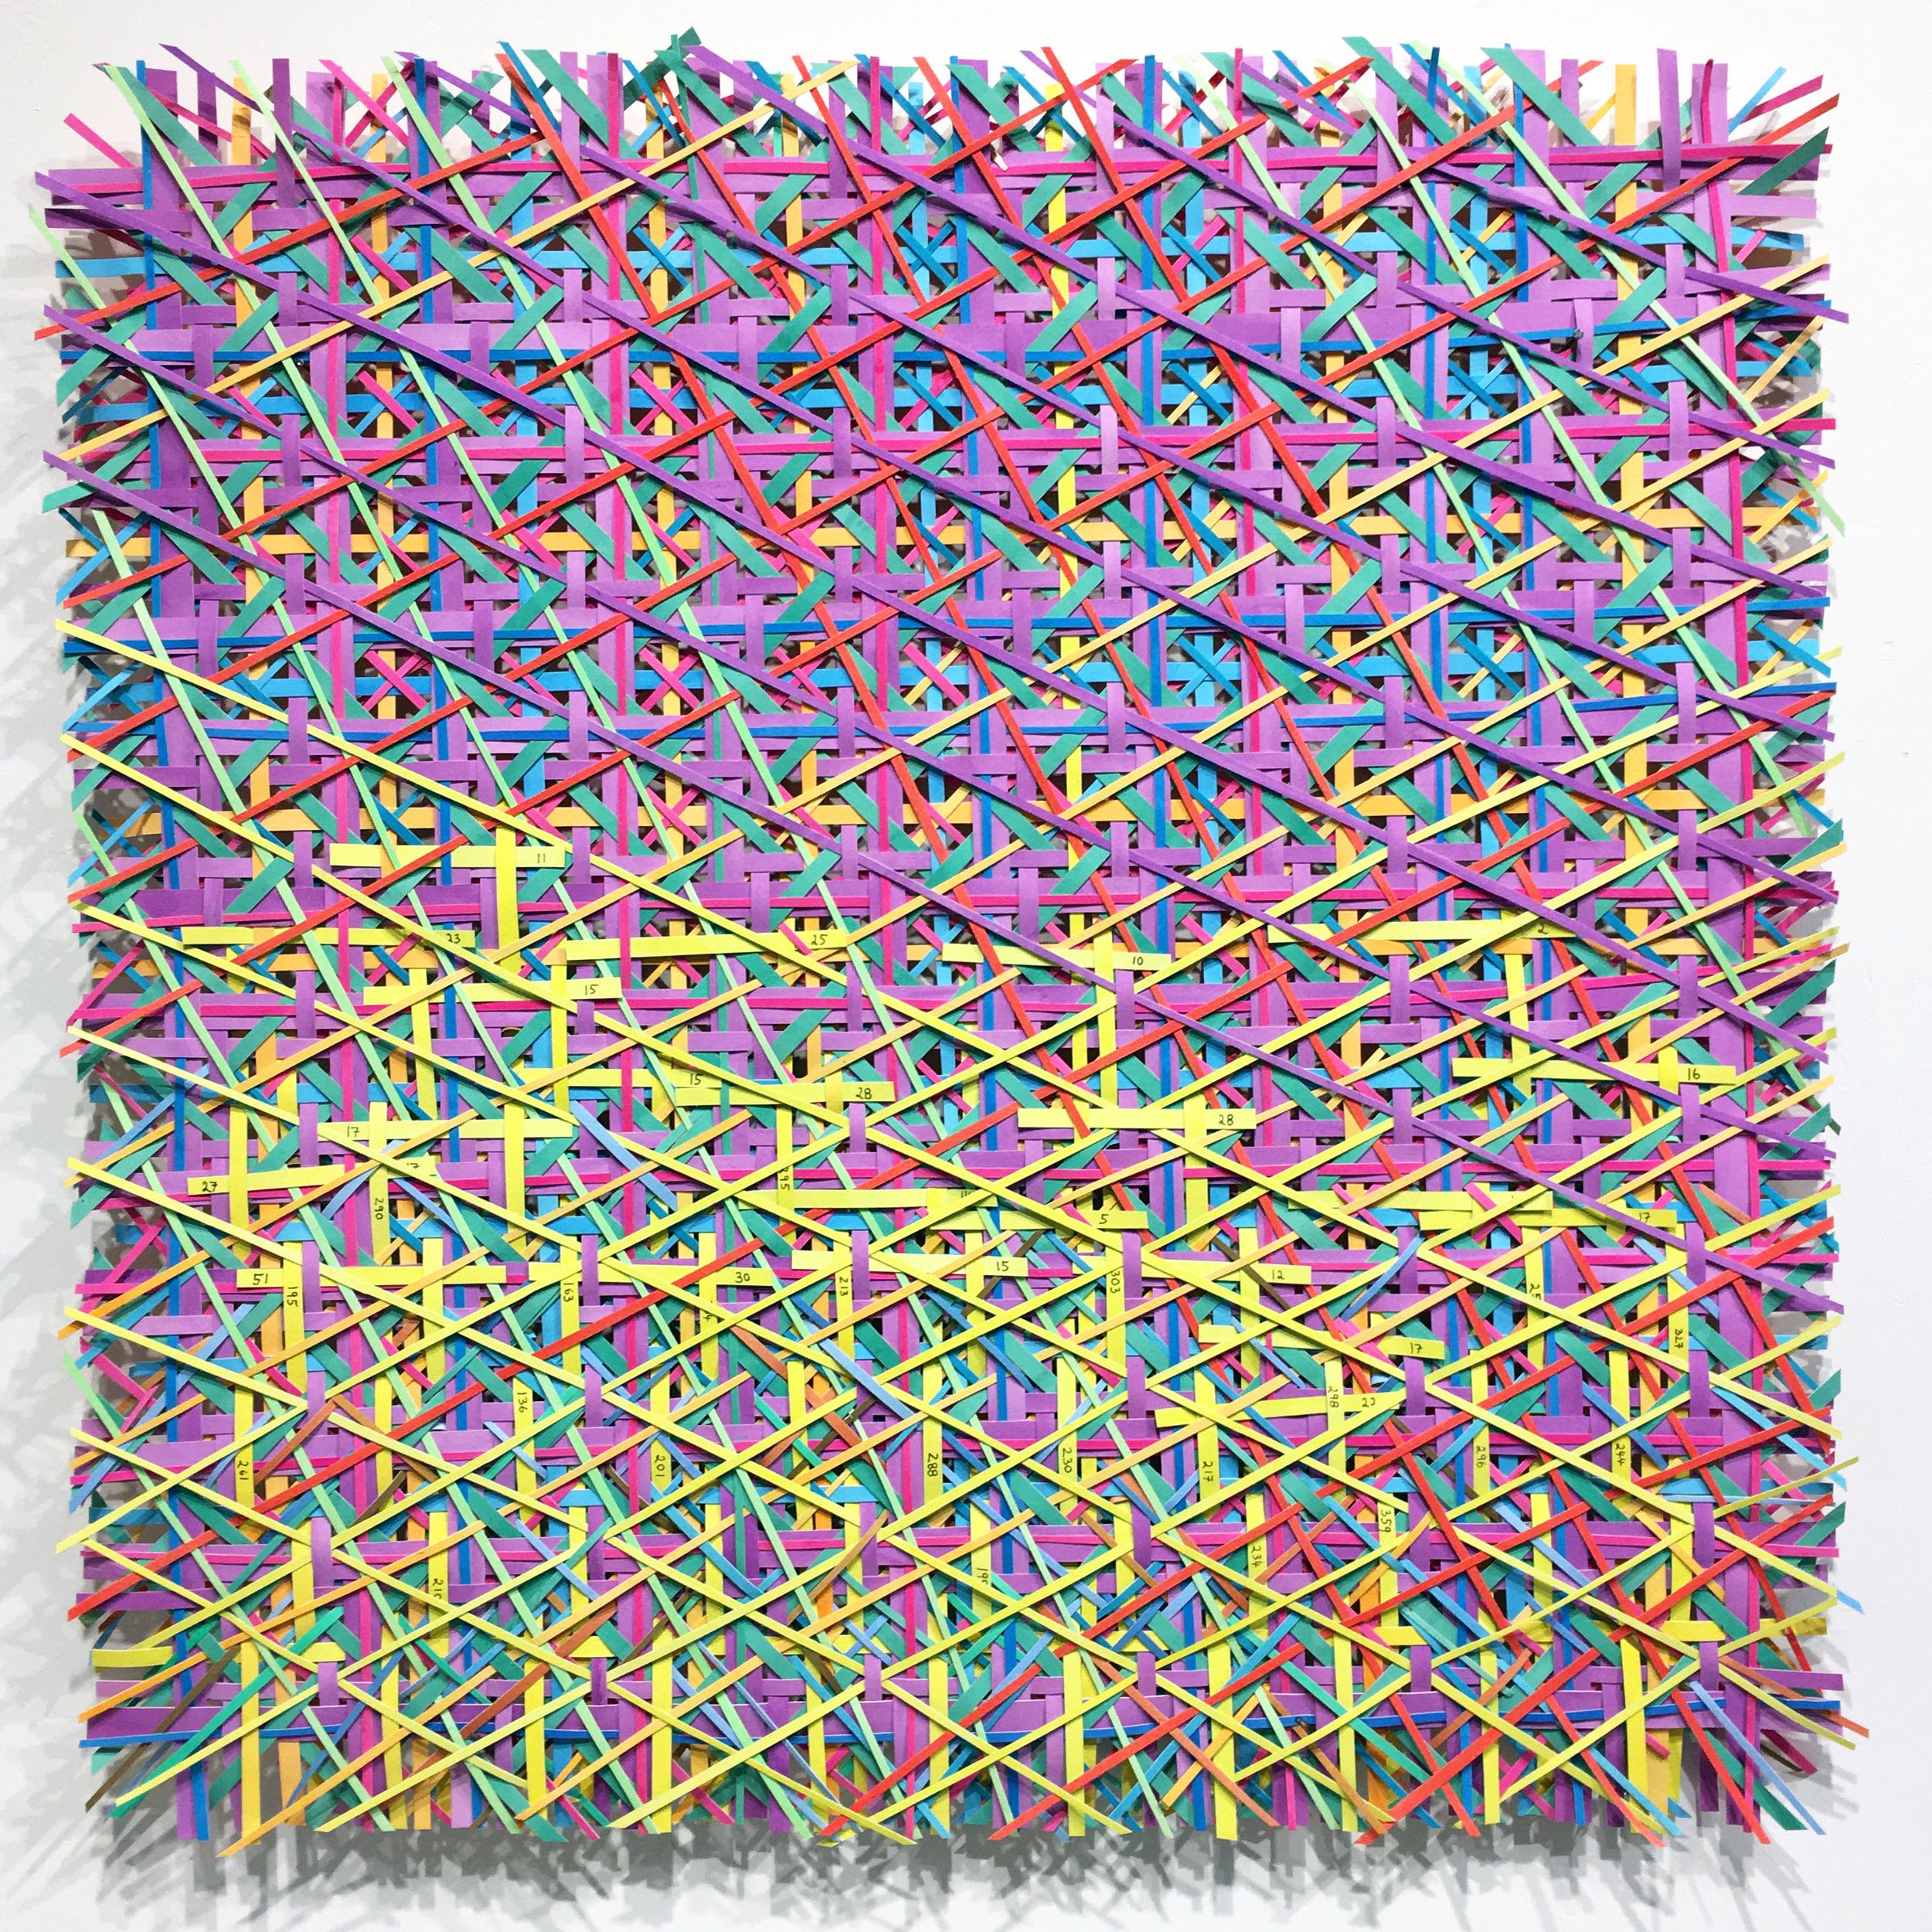
The Waverley Flood / 2022 / 20”x20”/ Paper, string, data / The town of Waverley, TN, was heavily damaged during a flood on Aug 21, 2021, when a series of thunderstorms unleashed a torrential downpour that quickly led to flash flooding. This is part of a series of weavings that looks at communities that struggled with weather disasters in the midst of a global pandemic. Data translates include weather and Covid-19 data from the region of Waverley and and the state of Tennessee. Information on how the data is translated in the piece is included.
The Two Idas / 2021 / Paper, data / 20"x20" / This piece follows the path of Hurricane Ida and focuses its data translation on New Jersey and Alabama. Data translated include precipitation amounts, Covid data, weather data and storm track. SOLD

The Lytton Fire / 2021 / Paper, data / 20"x20" / Lytton is a small town in British Columbia, situated at the junction of the Fraser and Thompson Rivers, surrounded by mountains. On June 30, 2021, a wildfire sparked by excessive heat in the region burned down 90% of the town and many of the Lytton First Nation communities in the area. The day before, temperatures reached 121 degrees Fahrenheit. This piece translates temperature, wind, Covid-19 data and geographic markers of this event.

Stay Healthy and Strong – September 2021 2021 / Paper, string, data / 20”x20” / This piece translates weather data (cloud cover, temperature and wind) from various locations where my family resided during the month of September 2021: Lyon, Chamonix, Boston and Sheridan. Also included are Covid-19 infection and death rates of Sheridan, WY, where I was living at the time.
Hurricane Ida / 2021 / Paper, string, data / 20"x20" This piece translates weather data from Hurricane Ida, as well as Covid-19 infection and death rates from both Alabama and New Jersey where the storm created the most damage. SOLD

Stay Healthy and Strong - Dec 2021 / 2022 / Paper, string, data / 20”x20” / This piece translates weather data (cloud cover, temperature and wind) from various locations where my family resided during the month of December 2021: Lyon, Daytona Beach and Boston. This was also the month when the omicron variant surged in many countries. Also included are Covid infection rates from Massachusetts, Florida, France and the US.

Stay Healthy and Strong – August 2021 / 2021 / Paper, string, data / 20”x20” / This piece translates weather data (cloud cover, temperature and wind) from various locations where my family resided during the month of August 2021: Lyon, Daytona Beach, Boston, Puerto Rico and Sheridan. Also included are Covid-19 infection and death rates of Boston, MA, where I was living at the time. SOLD

Stay Healthy and Strong - July 2021 / Paper, bamboo, data/ 20"x20"/ This piece translates weather data (cloud cover, temperature and wind) from various locations where my family resided during the month of July 2021: Lyon, Daytona Beach and Boston. Also included are vaccination rates and Covid-19 deaths for Massachusetts, Florida and France during that month. SOLD

April 2020: Weaving Weather During Quarantine / 2020 / Watercolor on paper / 26”x28” / Cloud cover and temperatures readings from Boston, MA during quarantine in April 2020. SOLD
Please Wear A Mask. My Parents Are Out Shopping / 2020 / Watercolor on paper / 22"x22” / The hardest part of quarantine is not being able to physically be there for the ones you love. I felt that very distinctly during June 2020, when Covid 19 infection rates were rising rapidly in the town where my parents live. This piece translates weather data and Covid 19 data for Florida, when infections rates were rising dramatically. SOLD
Please Wear A Mask. My Parents Are Out Shopping (Backside) / 2020 / Watercolor on paper / 22"x22” / The hardest part of quarantine is not being able to physically be there for the ones you love. I felt that very distinctly during June 2020, when Covid 19 infection rates were rising rapidly in the town where my parents live. This piece translates weather data and Covid 19 data for Florida, when infections rates were rising dramatically. SOLD
July 2020: Weaving Weather During Quarantine 2020 / Watercolor on paper / 22”x22” / Cloud cover, temperatures, Covid-19 infection rates and death rates for Boston, MA during quarantine in July 2020. SOLD
July 2020: Weaving Weather During Quarantine (Backside) / 2020 / Watercolor on paper / 22”x22” / Cloud cover, temperatures, Covid-19 infection rates and death rates for Boston, MA during quarantine in July 2020. SOLD .
May 2020:Weaving Weather During Quarantine / 2020 / Watercolor on paper / 22”x22” / Cloud cover and temperatures readings from Boston, MA during quarantine in May 2020. SOLD
Stay Safe and Healthy: July 2020 / 2020 / Watercolor on paper / 22”x24” / Cloud cover, temperature readings from three places I have loved ones in quarantine: Florida, Boston and Lyon (France). Also included are Covid-19 infection rates and death rates for Massachusetts in July 2020. SOLD

Stay Safe and Healthy: July 2020 (Backside) / 2020 / Watercolor on paper / 22”x24” / Cloud cover, temperature readings from three places I have loved ones in quarantine: Florida, Boston and Lyon (France). Also included are Covid-19 infection rates and death rates for Massachusetts in July 2020. SOLD
Stay Safe and Healthy: June 2020 / 2020 / Watercolor on paper / 22”x24” / Cloud cover and temperature readings from three places I have loved ones in quarantine: Florida, Boston and Lyon (France). SOLD